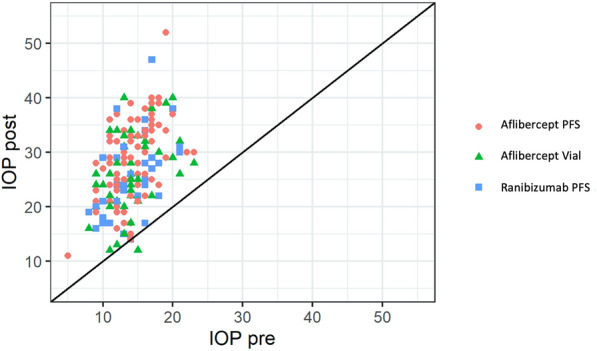
Figure 4.

Scatterplot of intraocular pressures (IOP) pre- and post-treatment, stratified by type of intravitreous injection (IVI). Respective Pearson correlations were R = 0.55 (p = 0.001), R = 0.37 (p = 0.008) and R = 0.45 (p = 0.006) in the aflibercept PFS, aflibercept vial and ranibizumab PFS groups, respectively. Abbreviations: IOP post intraocular pressure after injection, IOP pre intraocular pressure before injection, PFS prefilled syringes.
