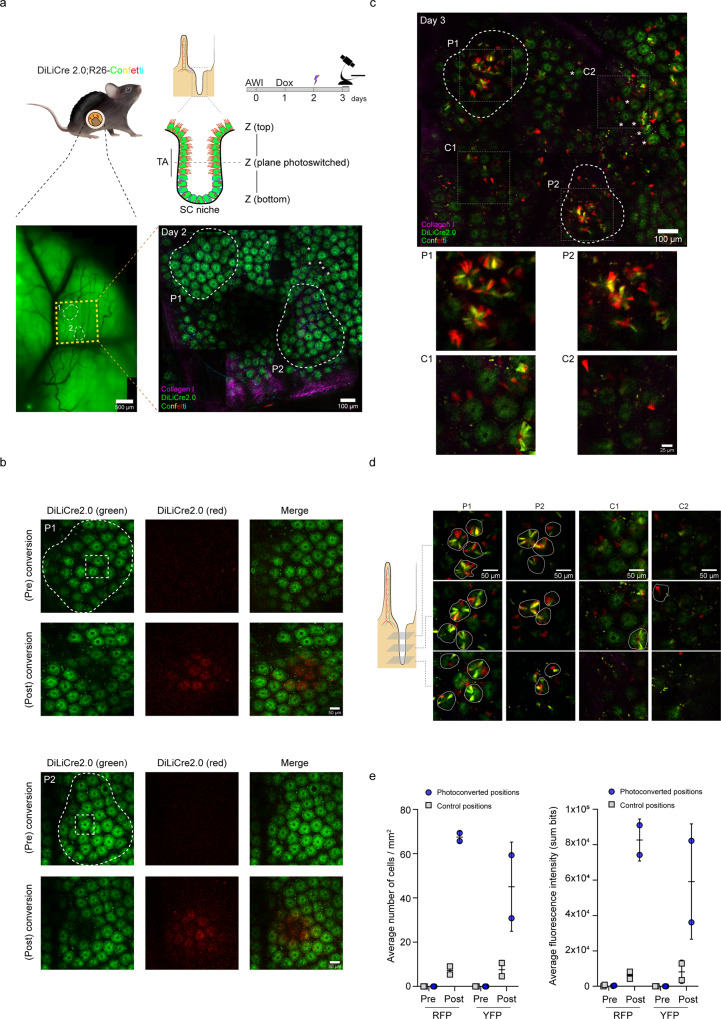
Fig. 4. DiLiCre2.0 mouse model to perform positional-cell tracing in the intestine in vivo.
a Schematic representation of the mouse model and the experimental setup. Left image shows a widefield tissue overview of the small intestine, highlighting the area scanned by two-photon microscopy (yellow boxed square). The right image shows the two-photon image corresponding to the yellow boxed area on the left, where individual intestinal crypts can be identified. This image also contains the two regions of interest (ROIs) (P1 and P2) that were subsequently subjected to photoactivation (white dotted circles). White asterisks are displayed to help the reader to recognize the same structures in the following panels. This experiment was independently repeated n = 3 times with similar results. b Magnifications of the two ROIs from panel a are depicted. Within each ROI, regions boxed in white dotted squares are subsequently exposed to 405 nm laser light (imaged with 7.95 ± 2.19 mW laser output power for 45 s). Images before and after photoconversion are shown. A Gaussian-blur filter was applied for visualization purposes. c A longitudinal two-photon overview of the same intestinal area shown in panel a (yellow square) 24 h post-photoconversion is shown. The two ROI regions described in panel a (P1 and P2) and the two zoom-in photoconverted areas depicted in panel b are indicated. Control regions are also annotated (C1 and C2). Control positions were selected randomly at least 150 µm away from the photoconverted areas. Detailed magnifications from both photoconverted and control regions are shown below. d Representative single z-planes of two-photon images along the submucosa and the lumen axis one day after photoconversion. Clusters of RFP or YFP “wedge” cells within the intestinal crypts are annotated using white dotted lines. Light exposed positions (P) and control regions (C) are shown. e Quantification of RFP and YFP cell numbers and fluorescence intensities pre- and post-photoconversion (~24 h post-conversion). Measurements were performed in the photoconverted and non-photoconverted areas. Same square dimensions were used for all measured positions (225 × 225 µm). Control positions were selected randomly at least 150 µm away from the photoconverted areas. Data represents mean ± SD. n = 3 biologically independent experiments/mice were performed with similar results. Source data are provided as a Source Data file.

