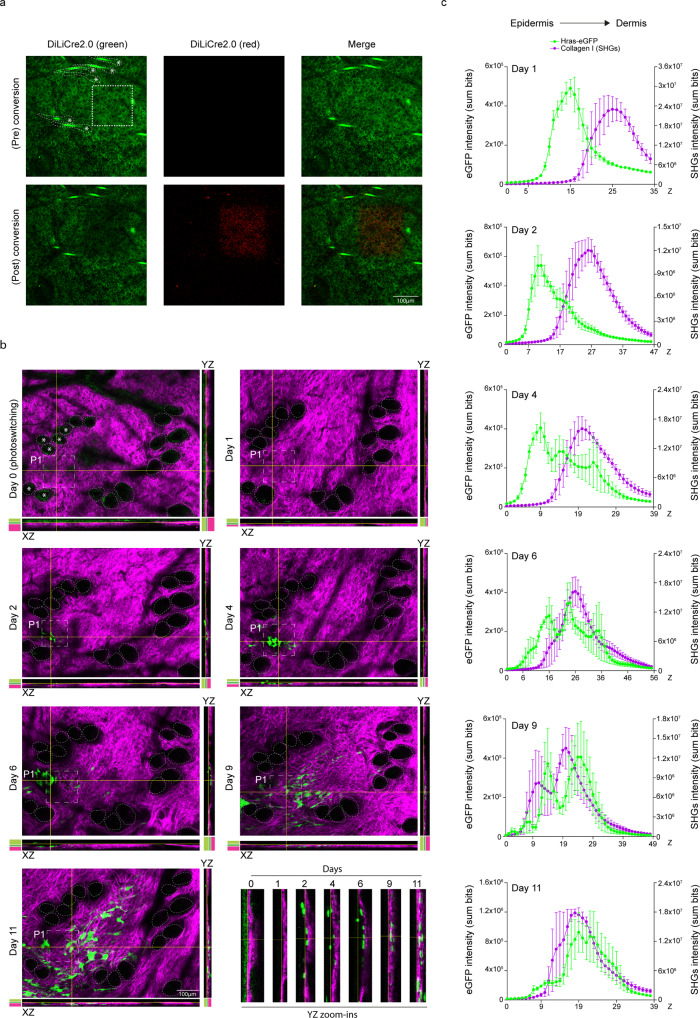
Fig. 6. Tracing the fate of cells that express HrasV12 upon localized DiLiCre2.0 activation.
a Photoconversion of DiLiCre2.0 at the basal layer region of the skin in DiLiCre2.0;HrasV12-eGFP animals. A Gaussian-blur filter was applied for visualization purposes. The photoconverted region is outlined by a white dotted square. Dotted lines and asterisks highlight the hair follicles of reference to help the reader localizing the same regions on the following panels. b Representative longitudinal two-photon images containing one photoconverted area (boxed by a white dotted square). A representative image of the z-stack and the XZ and YZ orthogonal views are annotated per imaging day. HFs are encircled by dotted lines to help the reader identifying the same structures along the experiment. Asterisks were used to make reference to the same HFs annotated in a. Color codes denote the relative position of the epidermis (light green), the basal layer (dark green), and the dermis (magenta). n = 3 biologically independent experiments/mice were performed with similar results. c Quantification of HrasV12-eGFP and SHGs (days 1, 2, 4, 6, 9, 11) intensities along the z-axis from the in vivo experiments shown in panel b. Graphs show the location of HrasV12 recombinant cells within the skin which is determined by measuring the total HrasV12 (eGFP) and dermal collagen I (SHGs) intensities at each z-plane. Each line represents the average intensities of n = 5 photoconverted regions. One of those photoconverted region is shown in b. Data represents mean ± SEM. Source data are provided as a Source Data file.

