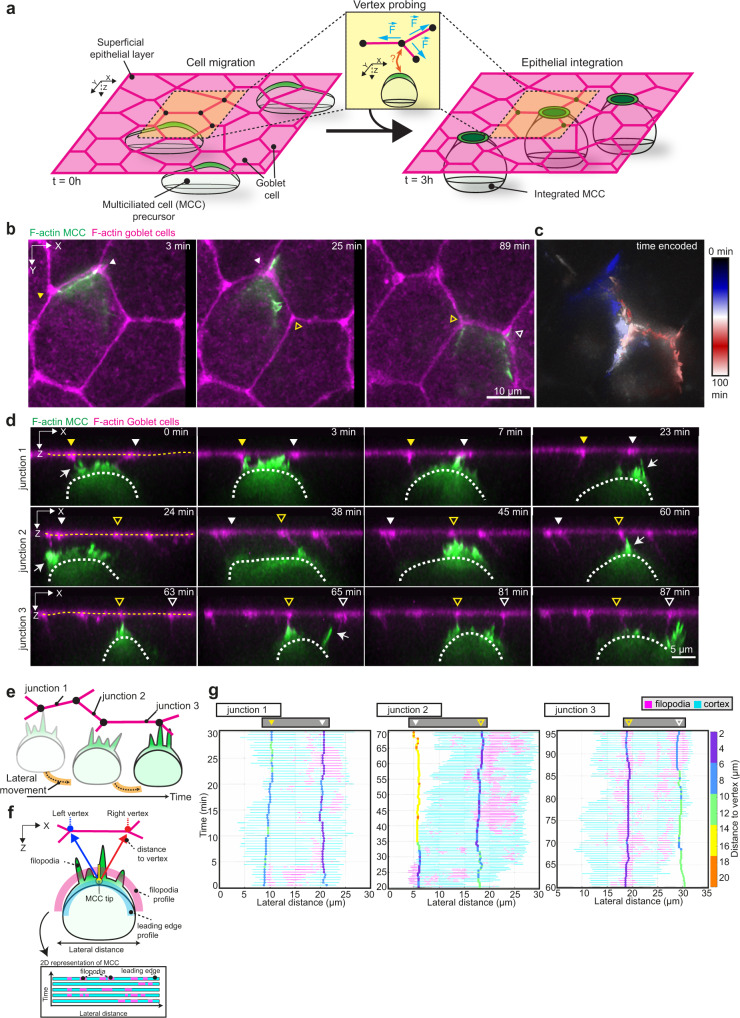
Fig. 1. Multiciliated cells probe the neighboring environment during integration.
a Schematics representing multiciliated cell (MCC) integration into the superficial epithelium. MCCs (in green) migrate into the superficial epithelium (t = 0 h) to integrate at the epithelial vertices formed by the neighboring goblet cells (in magenta) (t = 3 h). Inset depicts vertex probing by a single MCC. Epithelial vertices (black dots) form hotspots of mechanical tension as connecting junctions (magenta) pull on the vertex (blue arrows). b–g Dynamics of vertex probing by MCCs. MCC expresses α-tubulin::LifeAct-GFP (pseudo-colored in green) while goblet cells express nectin::utrophin-RFP (pseudo-colored in magenta). Yellow and white arrowheads, with and without fill, mark the position of different vertices and white arrows point to filopodia. b Image sequence from XY projection of MCC moving in between the overlying goblet cells. Scale bar: 10 μm. c Temporal-color-coded XY projection of MCC in b. d Orthogonal (XZ) projections of MCC in b used for filopodia dynamics analysis. White dotted lines outline the MCC contour and yellow dotted lines outline the top of the superficial epithelium. Arrowheads mark the position of the epithelial vertices. Scale bar: 5 μm. e Schematics representing the lateral movement of integrating MCCs. f Schematic representation of the main components of the filopodia analysis pipeline (see “Methods”). g Filopodia analysis of integrating MCC from d. The relative position of F-actin protrusions (filopodia, magenta) extended by a single MCC from its leading-edge (cyan, each line representing an individual time point) and the overlying epithelial vertices (vertical tracks, color-coded for the distance to vertex (between the MCC tip and the left or right vertex)) during MCC lateral movement. Arrowheads mark the position of the epithelial vertices as in d.

