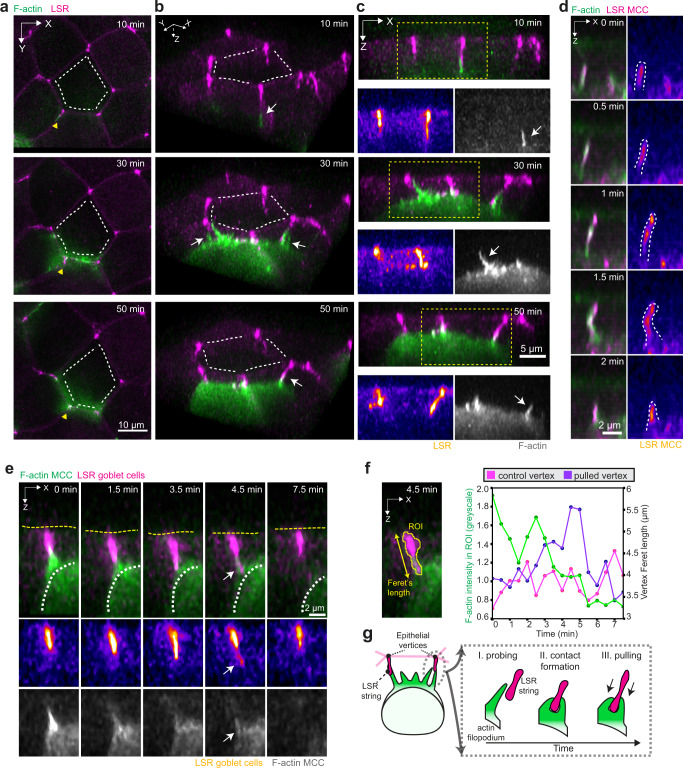
Fig. 2. Integrating MCCs pull on the epithelial vertices.
a–d Filopodia interact with epithelial vertices as MCC moves into the superficial epithelium. The actin cortex of MCCs is labeled with α-tubulin::LifeAct-RFP (pseudo-colored in green in composite images and gray as a separate channel). a Image sequence of integrating MCC interacting with overlying vertices. Epithelial vertices are labeled with lipolysis stimulated lipoprotein receptor tagged with x3GFP (LSR, pseudo-colored in magenta in composite images and fire as a separate channel). Scale bar: 10 μm. White dotted lines outline overlying junctions. The yellow arrowheads depict the orientation used for 3D rendering in b. b 3D rendering of a, with MCC forming contacts with different vertices (marked by white arrows). White lines outline overlying junctions. c Orthogonal (XZ) projections of a, depicting the attachment between filopodia (marked by white arrows) and vertices. Yellow boxes mark insets for separate channels. Scale bar: 5 μm. d Close-up of LSR-GFP (pseudo-colored in magenta in composite and fire as a separate channel) localization within a growing and retracting filopodium, visualized by F-actin marker (LifeAct, pseudo-colored in green). LSR is visualized by expressing α-tubulin::LSR-GFP. Scale bar: 2 μm. e Orthogonal (XZ) projections of filopodium pulling on the epithelial vertex (marked by white arrows). The epithelial vertex is marked by expressing nectin::LSR-GFP. The white dotted line outlines the MCC contour and the yellow dotted line outlines the apical surface of the superficial epithelium. Scale bar: 2 μm. f Quantification of vertex pulling from e. The MCC F-actin intensity (green) and vertex length during one event of vertex pulling (purple) and for a non-pulled vertex (magenta). g Schematics representing MCC probing and vertex pulling.

