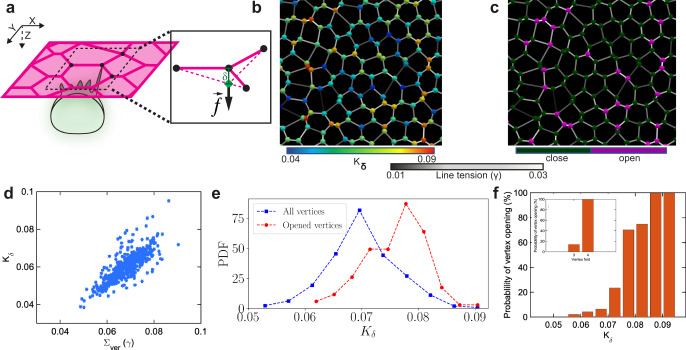
Fig. 3. Vertex model predicts that vertices with higher-fold and net line tension provide preferred spots for MCC integration.
a Schematics represent the out-of-plane force (f) exerted by an integrating MCC on an epithelial vertex inducing an out-of-plane displacement (δ). b Representative snapshot of the simulated cellular network. The colormap on junctions indicates line tension (γ), while the vertices are color-coded according to their stiffness (Kδ). c Representative snapshot of the cellular network illustrating propensity of vertices to open upon cell integration. Purple (dark green) vertices mark vertices with successful (failed) insertions. d Vertex stiffness increases with the increasing sum of line tensions at each vertex. e The probability density function (PDF) of the vertex stiffness distributions for all vertices in the simulated cellular network (blue) and the vertices with successful integration events were (red). f The probability of vertex opening for varying vertex stiffness values. The inset shows the opening probability for threefold vs. fourfold vertices.

