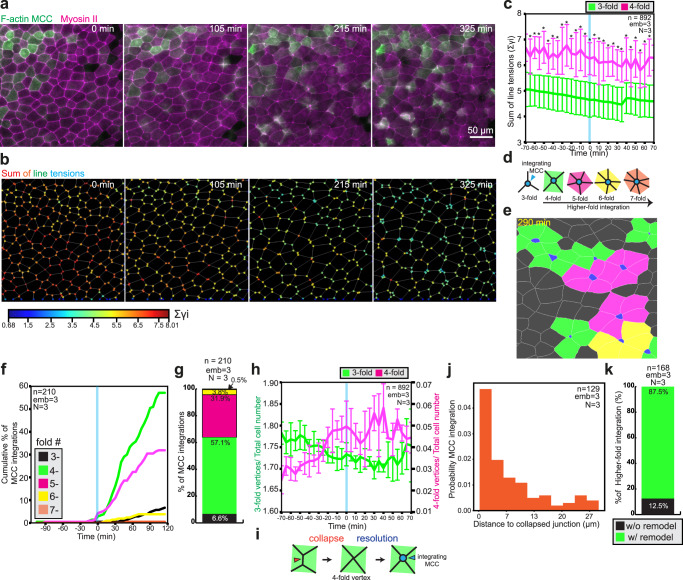
Fig. 4. MCCs integrate at higher-fold, stiffer vertices.
a Snapshots of superficial epithelium throughout MCC integration. MCCs and myosin II are labeled by expressing α-tubulin::LifeAct-RFP (pseudo-colored in green) and the myosin intrabody SF9-3xGFP (pseudo-colored in magenta), respectively. Scale bar: 50 μm. b Sum of line tensions across time color-coded from low (blue) to high tensions (red) extracted from a. c Sum of line tensions for threefold vertices (green) and fourfold vertices (magenta) during MCC integration (from n = 892 cells from 3 embryos, N = 3 experiments). Data show mean ± SD, asterisks represent significant statistical differences between datasets. Two-tailed Mann–Whitney test *p = [2.00E−13, 0.00176]. d–g Quantification of MCC integration according to the number of neighboring goblet cells. d Schematics representing higher-fold integrations, color-coded according to the number of neighboring cells. e Segmented image depicting higher-fold cell integrations, color-coded according to d. Apically expanding MCCs are marked in blue. f Cumulative percentage of MCC integrations across time. T = 0 marks the onset of MCC integration (defined as the 1% addition of new MCCs into the epithelium) (n = 210 cells from 3 embryos, N = 3 experiments). g Total percentage of MCC integrations according to the number of neighboring cells. (n = 210 cells from 3 embryos, N = 3 experiments). h Time evolution of threefold vertices (green) and fourfold vertices (magenta) number (from n = 892 cells from 3 embryos, N = 3 experiments). T = 0 (blue line) marks the onset of MCC integration (defined as the 1% addition of new MCCs into the epithelium). Data show mean ± SEM. i Schematics representing junction collapse (orange arrowhead) into a fourfold vertex and resolution by MCC integration (blue arrowhead). j The probability of MCC integration as a function of distance to the location of the closest junction collapse. k Relative percentages of MCC integration with (green) and without (black) junction remodeling (n = 168 cells from 3 embryos, N = 3 experiments).

