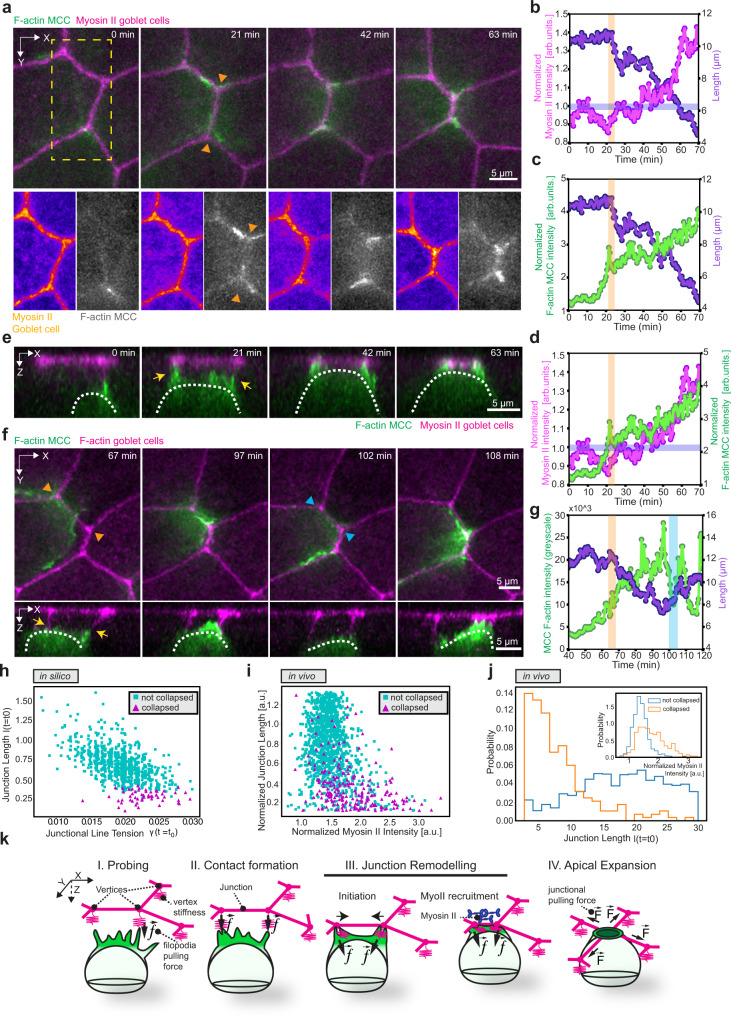
Fig. 5. MCCs remodel the overlying epithelium to enable cell integration.
a, e MCCs are labeled with α-tubulin::LifeAct-RFP (pseudo-colored in green in composite image and pseudo-colored in gray as separate channel) and myosin II in goblet cells is labeled by myosin II intrabody SF9-3xGFP (pseudo-colored in magenta in composite image and pseudo-colored in fire as separate channel). a Image sequence of epithelial junction remodeling during MCC integration. Scale bar: 5 μm. Orange arrowheads mark the onset of remodeling. b Normalized junctional myosin II intensity (magenta) and junction length (purple) during remodeling from a. Orange and blue bars mark the start of remodeling and normalized myosin II intensity equaling one, respectively. c Normalized MCC F-actin intensity (green) and junction length (purple) during remodeling from a. Orange bar marks the start of remodeling. d Normalized junctional myosin II (magenta) and normalized MCC F-actin (green) intensities during remodeling from a. Orange and blue bars mark the start of remodeling and normalized myosin II intensity equaling one, respectively. e Orthogonal (XZ) projections of a. Yellow arrows depict MCC contact with the epithelial vertices. Scale bar: 5 μm. f Vertex retraction during junction remodeling. MCC expresses α-tubulin::LifeAct-GFP (pseudo-colored in green) and goblet cells express nectin::utrophin-RFP (pseudo-colored in magenta). Orange arrowheads mark the onset of remodeling. Cyan arrowheads mark the loss of MCC contact with the vertices. Scale bar: 5 μm. White dotted line outlines the MCC contour. Yellow arrows depict contact with the epithelial vertices. g MCC F-actin fluorescence intensity (green) and junction length (purple) during junction collapse (indicated by the orange bar) and retraction (indicated by cyan bar) from f. h, i Stability-diagram of junction collapse in the normalized junction length-tension phase space from h in silico and i in vivo. The magenta triangles mark the junction length vs. line tension of collapsed junctions, while cyan squares represent non-collapsed junctions, when perturbed h by line tension changes (in silico) and i by MCC remodeling (in vivo). (See Supplementary Note 1). j Distribution of junction length and tension for collapsed and non-collapsed junctions in vivo showing stronger sensitivity of junction collapse to the initial length than to tension (shown in the inset). k Schematics representing the multi-step, cooperative process of junction remodeling.

