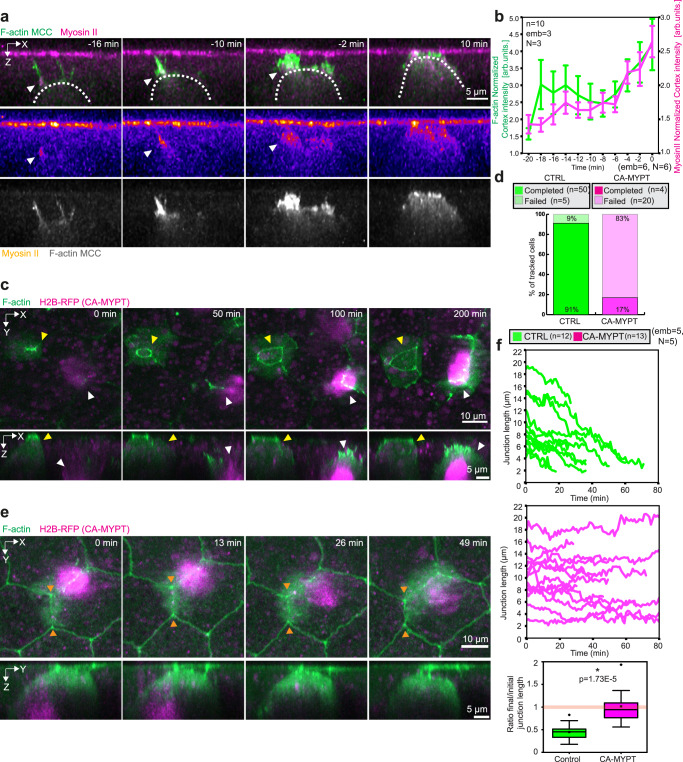
Fig. 6. Myosin II is specifically required in the MCCs for integration and epithelial junction remodeling.
a Orthogonal (XZ) projections of myosin II recruitment to the MCC leading edge during integration. MCC is labeled with α-tubulin::LifeAct-GFP (pseudo-colored in green in the composite image, pseudo-colored in gray as a separate channel) and myosin-II is labeled with the myosin intrabody SF9-3xGFP (pseudo-colored in magenta in the composite image, fire pseudo-colored as a separate channel). White arrowheads depict myosin recruitment. Scale bar: 5 μm. b Normalized myosin-II intensity (magenta) and normalized F-actin intensity (green) at the cortex of integrating MCCs. T = 0 marks the last tracked frame during integration (n = 10 cells from 3 embryos, N = 3 experiments). Data show mean ± SEM. c Image sequence of control MCC (yellow arrowhead) and CA-MYPT-overexpressing MCC (white arrowhead, marked with H2B-RFP pseudo-colored in magenta) during integration. Control and CA-MYPT overexpressing MCC express LifeAct-GFP mRNA (pseudo-colored in green). Scale bar: 10 μm. d Quantification of MCC integration success rates for control and CA-MYPT overexpressing cells (nWT = 55 cells, nCA-MYPT = 24 cells from 5 embryos, N = 5 experiments). e Image sequence of a CAMYPT-overexpressing MCC attempting epithelial junction remodeling (orange arrowheads). Goblet cells and CA-MYPT overexpressing MCC express LifeAct-GFP mRNA (pseudo-colored in green). Scale bar: 5 μm. f Junction length tracking for control (green) and CA-MYPT-overexpressing MCCs (magenta) (nWT = 12 junctions, nCAMYPT = 13 junctions from 5 embryos, N = 5 experiments). Boxplots of final to initial junction length ratio in control and CA-MYPT MCCs. The orange line indicates no overall junctional remodeling (final to initial junction length ratio = 1). Boxes extend from the 25th to 75th percentiles, with a line at the median and whiskers representing range within 1.5 interquartile range. Two-tailed Mann–Whitney test with 0.05 significance level *p = 1.73E−5.

