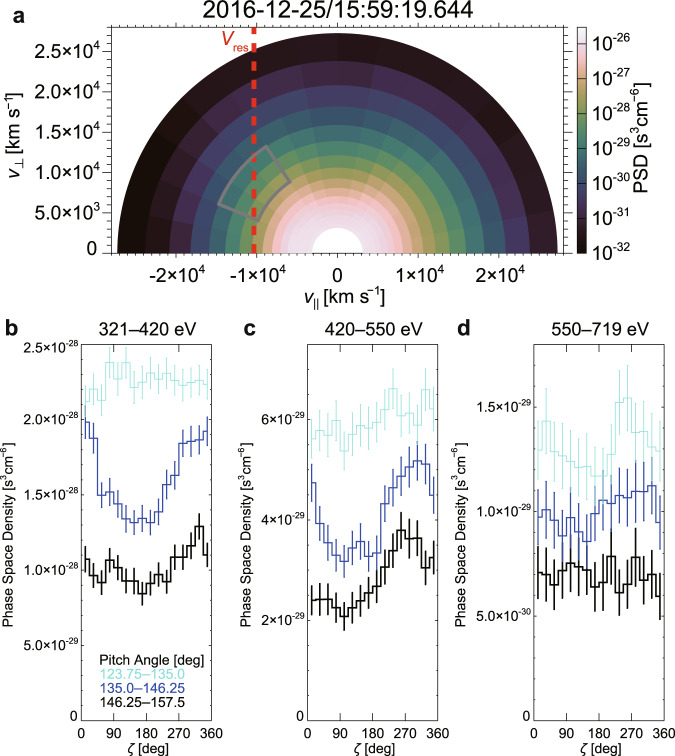
Fig. 3. Electron velocity distribution function (Event 1).
a Gyro-averaged electron velocity distribution function (28.3–2112 eV) with the cyclotron resonance velocity (Vres) shown as a red dashed line. b–d histograms of electron phase space density (PSD) in direction at 3 energy bins (fan-shaped area surrounded by a gray curve in Fig. 3a). The nongyrotropy significantly exceeded 2σ error bars (see Methods, subsection Electron and ion measurements by FPI) around Vres, while the electrons did not exhibit clear nongyrotropy around the pitch angle of about 130° below about 550 eV. This indicates confinement of this electron nongyrotropy around Vres. Electron data from 9 temporal bins (270 ms) around 15:59:19.644 UT (Fig. 4) from each spacecraft were used (see Methods, subsection Electron and ion measurements by FPI). The fan-shaped area surrounded by a gray curve corresponds to the pitch angle and energy ranges for the calculation of the resonant current (Jres) for Event 1.

