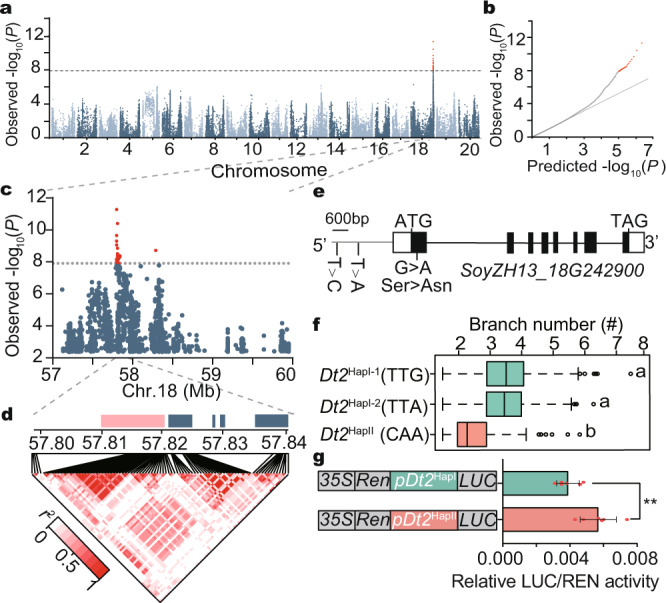
Fig. 1. GWAS of branch number and haplotype analysis of Dt2 in soybean.

a Manhattan plot of GWAS for branch number using 2 years of Blup data of the 2409 accessions. P values are calculated based on linear mixed model in GWAS and the dashed horizontal line indicates the genome-wide significance threshold (P = 1 × 10−7.9), which is determined by the Bonferroni test. −log10 P values are plotted against the position of SNPs on 20 chromosomes. b Quantile-quantile plot for the branch number. For quantile-quantile plot, −log10-transformed observed P values are plotted against −log10-transformed expected P values. c Genome-wide Manhattan plot in the 57–60 Mb region on chromosome 18. The red lead SNPs are shown above the threshold signals. d Linkage disequilibrium plot for SNPs in the 57.80–57.84 Mb region from a continuous association block. Navy blue box, genes. Pink box, candidate gene Dt2. Asterisk, position of the peak SNP. The color key (white to red) represents linkage disequilibrium value (r2) accessions. e Gene structure of Dt2. Two SNPs (−3259th T > C, −2580th T > A) in the promoter and a nonsynonymous SNP (+98th G > A) in the first exon are labeled on the gene sketch. f Haplotype analysis of Dt2HapI-1 (n = 1052 accessions), Dt2HapI-2 (n = 262 accessions) and Dt2HapII (n = 179 accessions). In each box plot (drawn by R 4.1.1 software), the center line indicates the median, the edges of the box represent the first and third quartiles, and the whiskers extend to span a 1.5 interquartile range from the edges. Different letters indicate statistically significant differences at P < 0.05 by one-way ANOVA test. g Promoter activity analysis of Dt2HapI and Dt2HapII using sequences 3,400-bp upstream from the translation initiation site (n = 5 biologically independent replicates), **P < 0.01, two-sided t-test, and P = 6.0 × 10⁻³. Data in (f, g) are the mean ± SEM. Source data are provided as a Source Data file.
