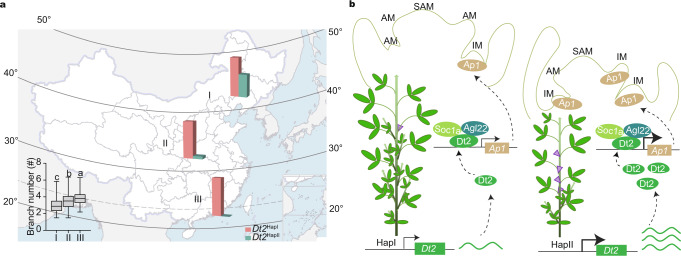
Fig. 5. Geographic distribution of different Dt2 haplotypes and a proposed working model of Dt2 in controlling branch number in soybean.
a Geographic distribution of Dt2 haplotypes in three different ecoregions. The column diagram is the percentage ratio between Dt2HapI and Dt2HapII. The bottom left box plot represents the branch number comparison of accessions in I (n = 695 accessions), II (n = 821 accessions) and III (n = 222 accessions) ecoregions. Data are the mean ± SEM. In box plot (drawn by R 4.1.1 software), the center line indicates the median, the edges of the box represent the first and third quartiles, and the whiskers extend to span a 1.5 interquartile range from the edges. Different letters indicate statistically significant differences at P < 0.05 by one-way ANOVA test. b Proposed working model of the role of Dt2 in controlling branch number in soybean. IM inflorescence meristem. AM axillary meristem. SAM shoot apical meristem. The purple triangles represent the transitions from AM to IM.

