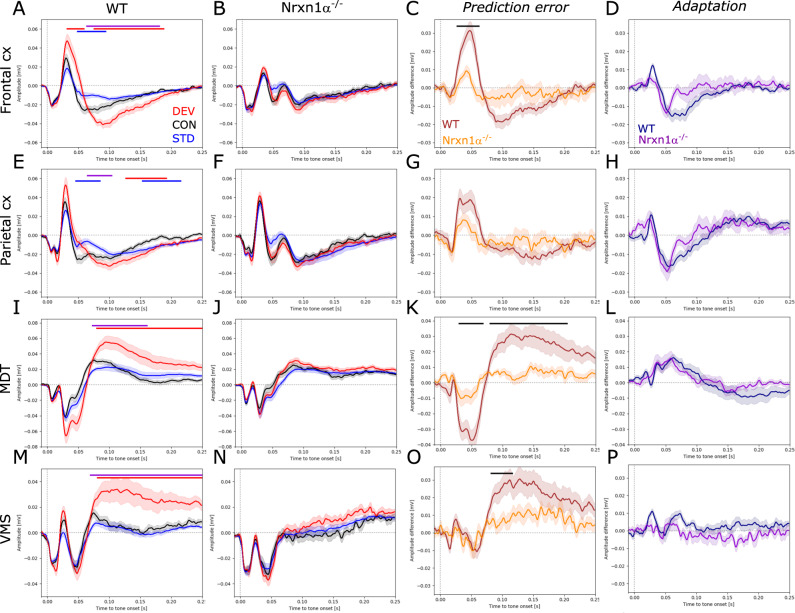
Fig. 4. Auditory event-related potentials and mismatch responses.
A, E, I, M Auditory-evoked potentials in the frontal cortex, parietal cortex, mediodorsal thalamus (MDT) and ventromedial striatum (VMS) of wildtype (N = 12) and B, F, J, N Nrxn1−/− rats (N = 15). Responses to the deviant tone depicted in red, to the control tone in black and to the standard tone in blue. C, G, K, O Difference waveforms between responses to the deviant and the control tone to reveal the prediction error, and D, H, L, P difference waveforms between responses to the control and to the standard tone to assess adaptation. Data displayed as mean + SEM and tested with paired or unpaired CBPT. Colored bars (red: deviant vs. control; blue: standard vs. control; violet: deviant vs. standard; black: WT vs. Nrxn1α−/−) above the graphs represent clusters with statistically significant differences.

