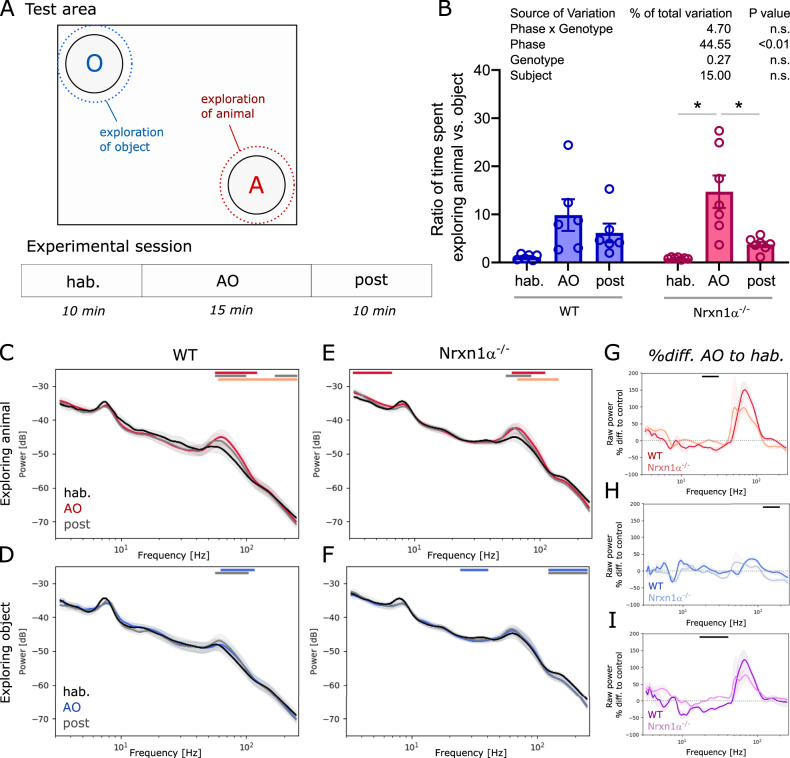
Fig. 5. Behavior and oscillatory activity during social response assay.
A Upper part: Schematic of test area, consisting of an open field with an object and an animal zone (rest = neutral zone) with the dotted lines indicating the area in which an encounter is scored as exploration; and lower part: Design of the experimental session (3 phases: habituation, hab; animal/object exploration, AO; post phase). B Box plot showing the ratio of time animals spent exploring the animal compared to exploring the object. Two-way ANOVA with Sidak’s multiple comparisons post-hoc test (*p < 0.05). Summary statistics for ANOVA results are displayed above the graphs. C, D Spectral density plots during exploration of the littermate or the object, respectively, for wildtype rats (N = 6) and E, F for Nrxn1α−/− (N = 7). G, H Plots displaying the percentage difference of spectral power during animal or object exploration (normalized to the power during the habituation phase), respectively. I Difference plots between spectral changes during animal exploration shown in G and object exploration shown in H. Data displayed as mean + SEM and tested with paired or unpaired CBPT. Colored bars (red or blue: AO vs. hab; gray: post vs.hab; light red or light blue: AO vs. post; black: WT vs. Nrxn1α−/−) above the graphs represent clusters with statistically significant differences.

