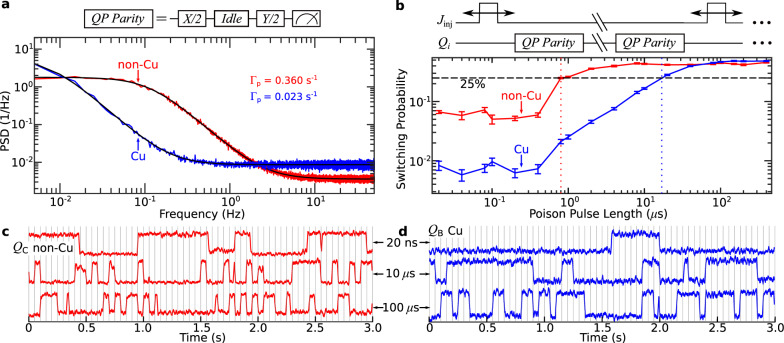
Fig. 3. Measurement of QP parity switching.
a Power spectral density of QP parity switching with no injection pulses for QA on non-Cu (red) and Cu (blue) chips. b Measured probability of parity switch per injection pulse vs. pulse duration for non-Cu and Cu chips; dotted/dashed lines indicate pulse lengths corresponding to 25% switching probability. Error bars computed from standard Poisson counting errors (see Supplementary Note 9). Pulse sequence for QP parity measurements without/with controlled phonon injection shown above plots in a/b. Segment of time series of QP parity for different injection pulse durations for (c) non-Cu chip, (d) Cu chip; vertical lines indicate timing of injection pulses.

