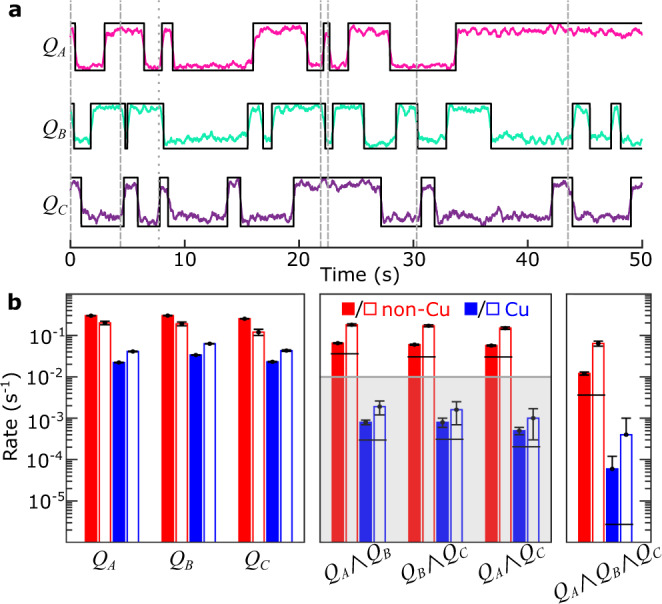
Fig. 4. Correlated parity switches from background radiation.

a Typical time trace of simultaneous QP parity measurements on non-Cu chip with no injection pulses. Black lines correspond to extracted digital signal from parity switches; vertical dashed (dotted) lines indicate double (triple) coincidences. b Observed parity switching rates (solid bars) and extracted poisoning event rates (open bars) for non-Cu (red) and Cu (blue) chips in the absence of controlled phonon injection. Expected random background coincidence rates are plotted as horizontal black lines. Error bars computed from Poisson counting errors (see Supplementary Notes 10 and 11). Fault-tolerant level for two-fold correlated errors, as described in the text, is indicated by gray-shaded region.
