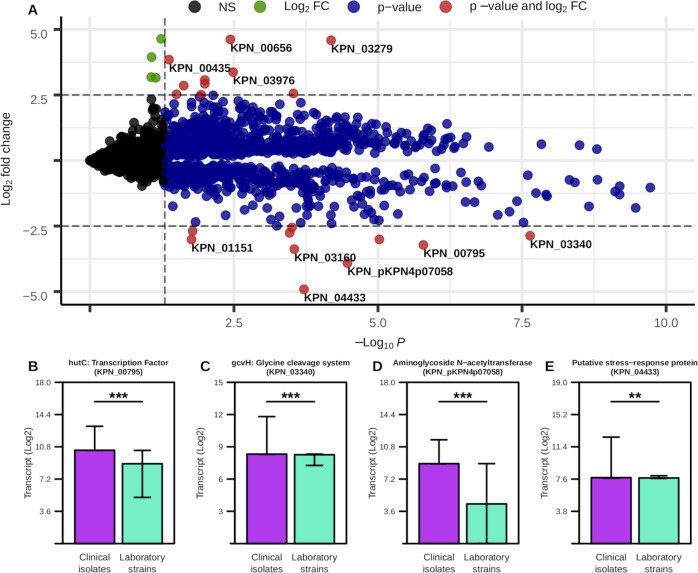
Fig. 1. Transcriptional differences between laboratory and clinical isolates of K. pneumoniae.
A Differential expression analysis with Log2 fold change cutoff = 2.5, p-value cutoff = 0.05. Genes with highest degree of difference are labeled. Each point is an individual gene and the color of the point corresponds to whether or not the Log2 fold change is not significant (black, NS), has a Log2 fold change > 2.5 (green, Log2 FC), has a p-value < 0.05 (blue, p-value), or a Log2 fold change > 2.5 and a p-value < 0.05 (red, p-value and log2 FC). B–E Median and interquartile ranges for select genes based on previous analysis. Significant differences determined by Wilcoxon rank-sum test with Benjamini–Hochberg correction (***p-value ≤ 0.001, **p-value ≤ 0.01).

