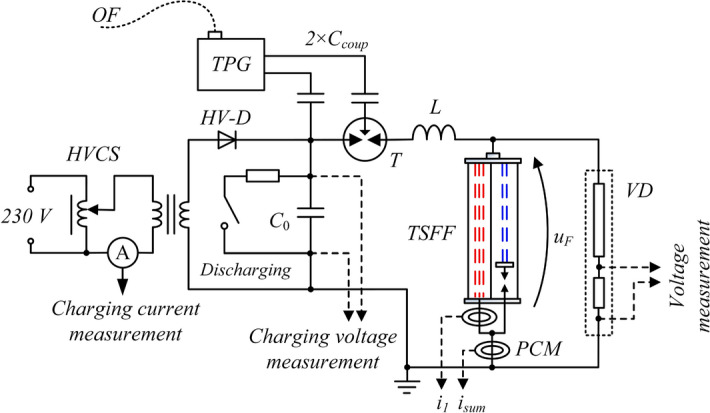
Figure 12.

Schematic diagram of the TSFF-based PFS laboratory test stand: C0 = 200 μF—battery of pulse capacitors charged to initial voltage UC0 = 10 kV, T trigatron, L = 2.8 μH—forming inductance, VD pulse voltage divider, PCM Pearson pulse current monitor, HV-D high voltage diode stack; HVCS high voltage charging system, TPG triggering pulse generator, OF optic fiber, Ccoup high voltage coupling capacitors, i1, isum current of the preparatory stage and total current of the fuse, uF voltage across the fuse.
