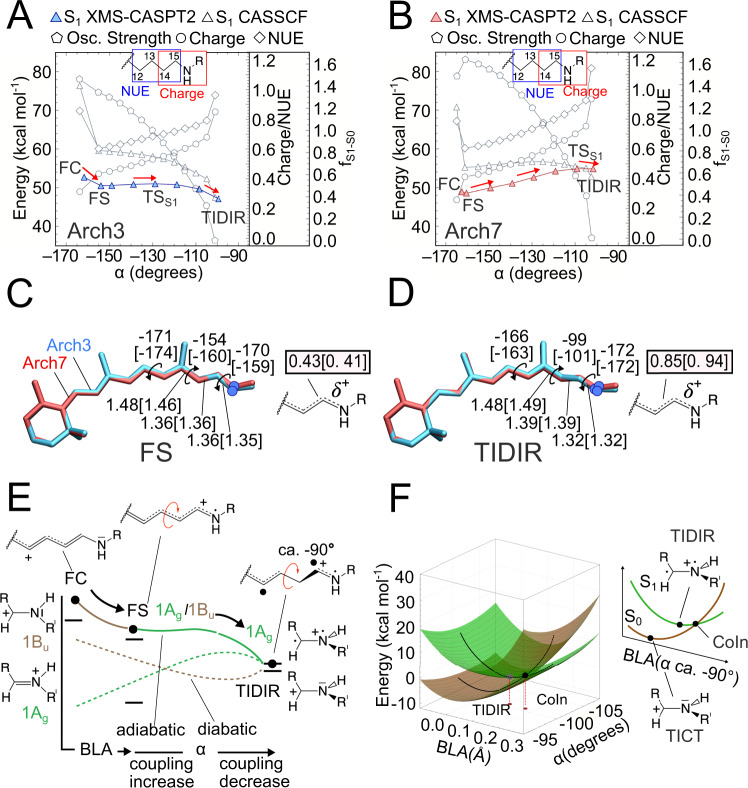
Fig. 2. Comparison between computed Arch3 and Arch7 S1 isomerization paths.
A Variations in potential energy (relative to the S0 equilibrium structure), charge distribution, free valence and oscillator strength along the Arch3 path. The energy profile in color is given after MS correction. Red arrows indicate progression along the isomerization coordinate. B Same data for Arch7. C Main geometrical chromophore parameters for the FS fluorescent intermediates of Arch3 and Arch7 (values in square brackets). The S1 positive charge fraction on the C-C-N moiety are also given. D Same data for the photoisomerization channel TIDIR. E Schematic “decomposition” of the Arch3 adiabatic energy profile of panel B in terms of diabatic states associated to Lewis formulas of the CH2 = NH2(+) minimal model. The progression of the electronic and geometrical structure of the relevant moiety of the full chromophore is given at the top. F Schematic representation of the CoIn region of Arch3 including the twisted diradical TIDIR along the relevant components of the reaction coordinate. The same coordinate also spans the CoIn branching plane. The potential energy scale is relative to the CoIn.

