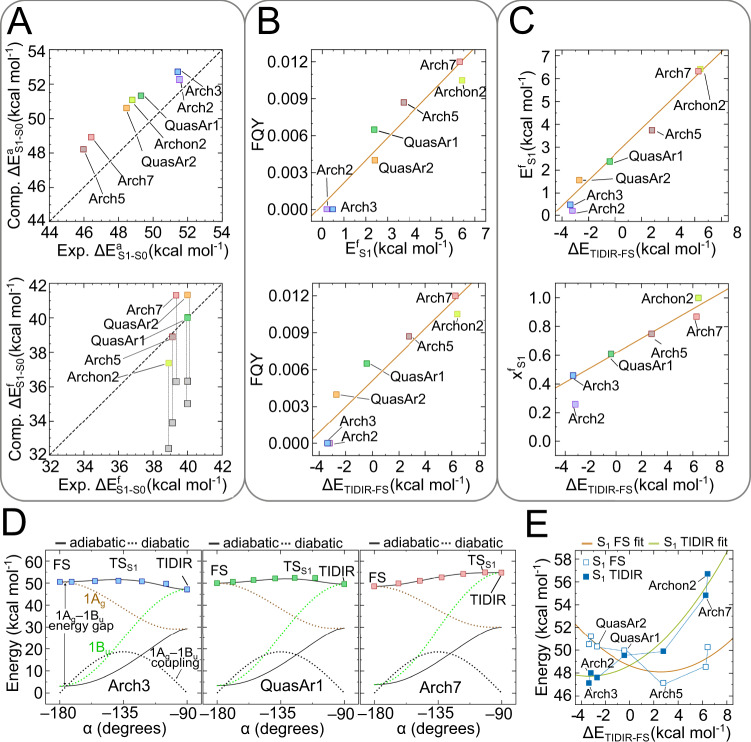
Fig. 3. Relationship between computed S1 isomerization properties and observed FQY along the Arch-set.
A Comparison between computed and observed excitation energies associated with light absorption at the ground state equilibrium structure (top) and light emission from the fluorescent state (bottom). Vertical excitation energy associated to emission features a correction of 4.5 kcal mol−1 to account for kinetic energy derived from ref. 24. Gray and colored squares represent the emissions before and after correction, respectively. B Relationship between S1 isomerization barrier and FQY (top) and between S1 isomerization energy and FQY (bottom). Linear fits are given as orange lines. C Relationship between S1 isomerization barrier and isomerization energy (top) and between S1 isomerization transition state position and isomerization energy for three Arch3 variants. Linear fits are given as orange lines. D One-dimensional model for the relationship between barrier and isomerization energy. E Non-linear relationship between the FS and TIDIR S1 excitation energies with respect to S0 FC and the isomerization energy. Source data are provided in the Source Data file (d).

