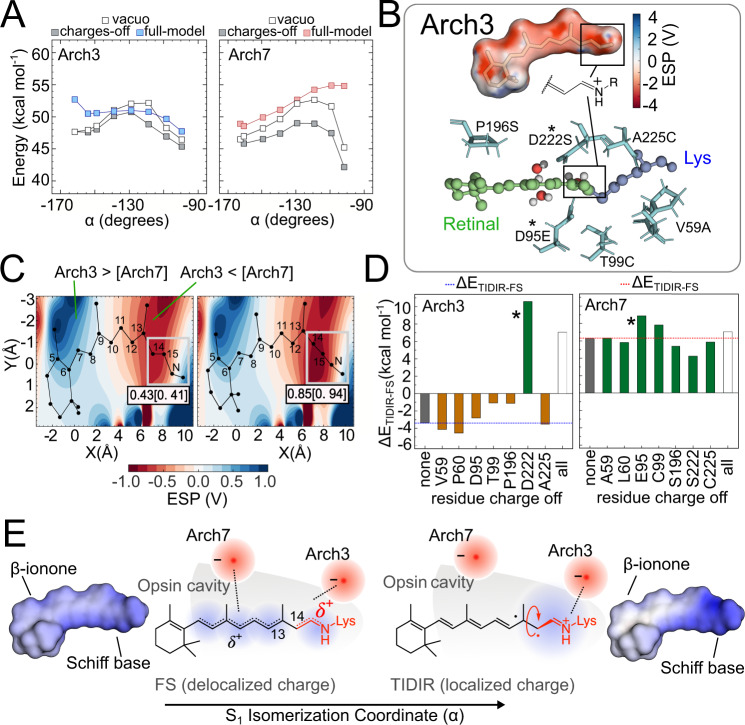
Fig. 4. Origin of the S1 isomerization barrier in Arch3 and Arch7.
A Effect of the opsin charges on the isomerization energy profile for Arch3 (left) and Arch 7 (right). B Top. Arch3 opsin electrostatic potential projected on the chromophore solvent accessible surface. Bottom. The cavity amino acids distinguishing Arch3 from Arch7. The * symbol indicates the Arch3 (D222) and Arch7 (E95) chromophore counterions. C Two-dimensional plots showing the Arch3-Arch7 electrostatic potential difference at FS (left) and TIDIR (right). The total charge of the framed Schiff-base moiety is also given. D Variation in the Arch3 (left) and Arch7 (right) isomerization energy value after zeroing the residue charge of the cavity residues in panel B bottom. Reference values are shown as gray bars. Negative and positive isomerization energies are shown in orange and green, respectively. Finally, the effect of zeroing the charges of all residues simultaneously is also given as an open bar. E Point charge model for the delocalization-confinement mechanism. The Arch3-Arch7 ESP difference of C can be modeled in terms of a re-locating effective negative charge from the Schiff base region to a cavity region displaced towards the β-ionone ring of the chromophore. The increase in distance between the effective charge and the confined positive charge of TIDIR explains its electrostatic destabilization in Arch7 with respect to Arch3. The computed chromophore electrostatic potential projected on the chromophore solvent accessible surface is given at the left and right of the figure to support the schematic representation of a delocalized and confined charge given at the center. Source data are provided in the Source Data file (a, c, d).

