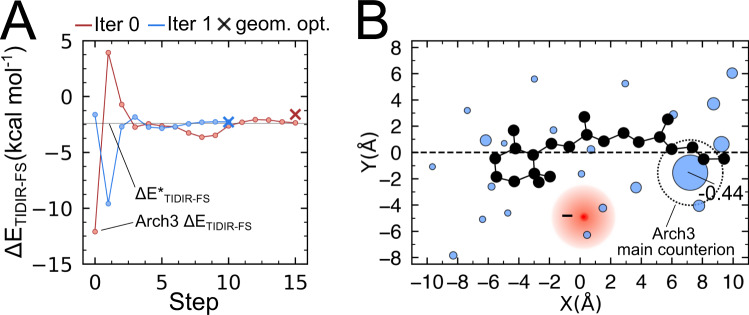
Fig. 5. Predicted change of counterion charge distribution of Arch3 QM/MM model to yield the Arch7 ΔETIDIR-FS value.
A ΔETIDIR-FS (SA2-CASSCF/AMBER level) change along the optimization steps leading from the Arch3 to the Arch7 value. The optimization is driven by the target ΔETIDIR-FS values (ΔE*TIDIR-FS, indicated by a thin horizontal line) and corresponds to the minimization of the square of the scalar function ΔETIDIR-FS(q) − ΔE*TIDIR-FS (i.e., ΔΔETIDIR-FS(q)) as a function of the cavity residue charge vector q. Each iteration of the algorithm (two full iterations are reported in the panel) is divided in two parts; (i) first q is optimized at fixed FS and TIDIR geometries via conjugated-gradient optimization such that ΔETIDIR-FS(q) = ΔE*TIDIR-FS and then (ii) the FS and TIDIR QM/MM model geometries are relaxed, and ΔETIDIR-FS is recomputed. If the difference between the ΔETIDIR-FS calculated after part ii and ΔE*TIDIR-FS is above a selected threshold, i-ii are repeated. The circles indicate the steps of part i, and the crosses indicate the results of geometrical relaxation of part ii. B Final charge distribution obtained after convergence of the optimization above. Two-dimensional representation of the fraction of negative charges residing in the cavity residues is proportional to the radius of the blue circles (the main counterion D222 final charge is indicated). The barycenter of the corresponding negative charge is shown as a red circle. The original localized Arch3 negative charge is indicated by the large open circle centered at the original counterion position Source data are provided in the Source Data file (a, b).

