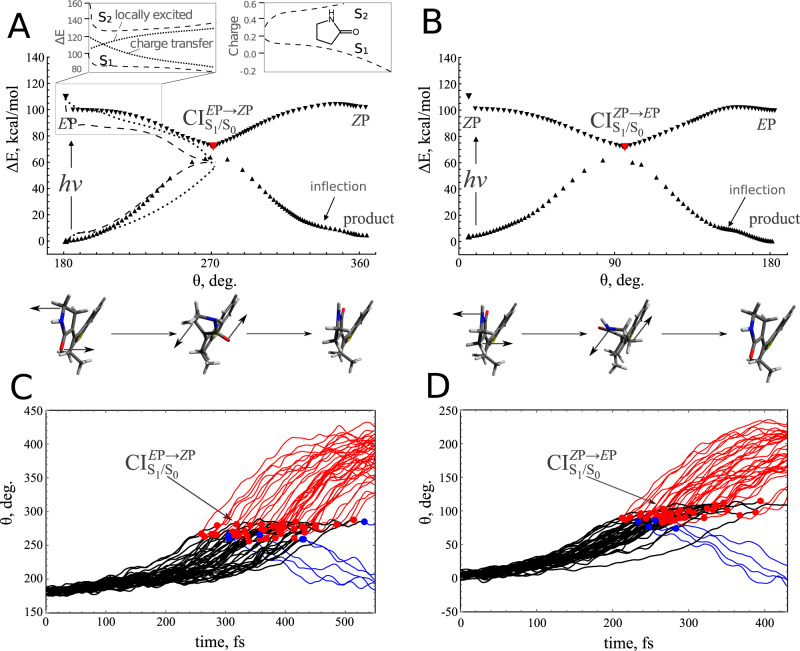
Fig. 4. Simulated gas-phase photoisomerisation of MTDP.
A Projection of the adiabatic minimum energy path (MEP) EP → ZP of the MTDP motor onto θ (see Fig. 1 for the definition of θ) calculated with the SSR method (triangles). The structures below the plot show the geometries of the reactant (EP), the conical intersection (CI) and the product (ZP). The arrows indicate a CCW motion. The dashed energy profiles correspond to 3-root state-average XMS-CASPT2 energies calculated with a 2 electrons in 2 π-orbitals complete active space. The dotted energy profiles show the corresponding 5-root state-average with a 10 electrons in 10 π-orbitals complete active space. The insets display the relationship between the S1 and S2 states along the framed region. An avoided crossing between a charge transfer and locally excited state is supported by plotting the charge residing on the pyrrolidinone (also called oxindole) ring in the two states. The S1 → S0 nonadiabatic relaxation occurs near the geometry of CI, which is shown by the red filled triangle. B The same for the ZP → EP step. C θ propagation during the quantum-classical population dynamics starting from EP. The propagation along the S1 PES (the black lines) is connected with the productive (the red lines) and unproductive (the blue lines) propagation along the S0 PES by the corresponding hop points (the red and blue circles) “imaging” a segment of the CI seam. D The same for the ZP → EP step. Source data are provided as a Source Data file.

