Figure 2.
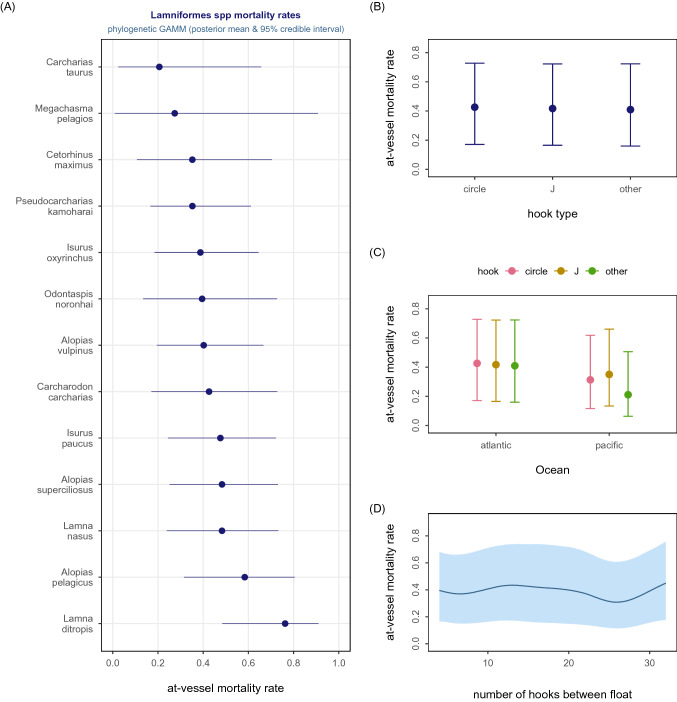
LAMNIFORMES. Graphical summary of the Bayesian phylogenetic meta-regression model (binomial-Normal GAMM) fitted to 466 AVM effect sizes compiled for this 13 shark species clade. Panel (A) shows the estimated conditional species-specific AVM rate arranged from lowest to highest rate. Panel (B) shows the estimated conditional hook shape effect on AVM. Panel (C) shows the estimated conditional effect of hook type within ocean basin effect on AVM. Panel (D) shows the estimated conditional effect of number of hooks between floats on AVM. Solid dot = posterior mean, horizontal or vertical bar = 95% credible interval, solid curve = mean nonlinear trend, shaded polygon = 95% pointwise credible interval.

