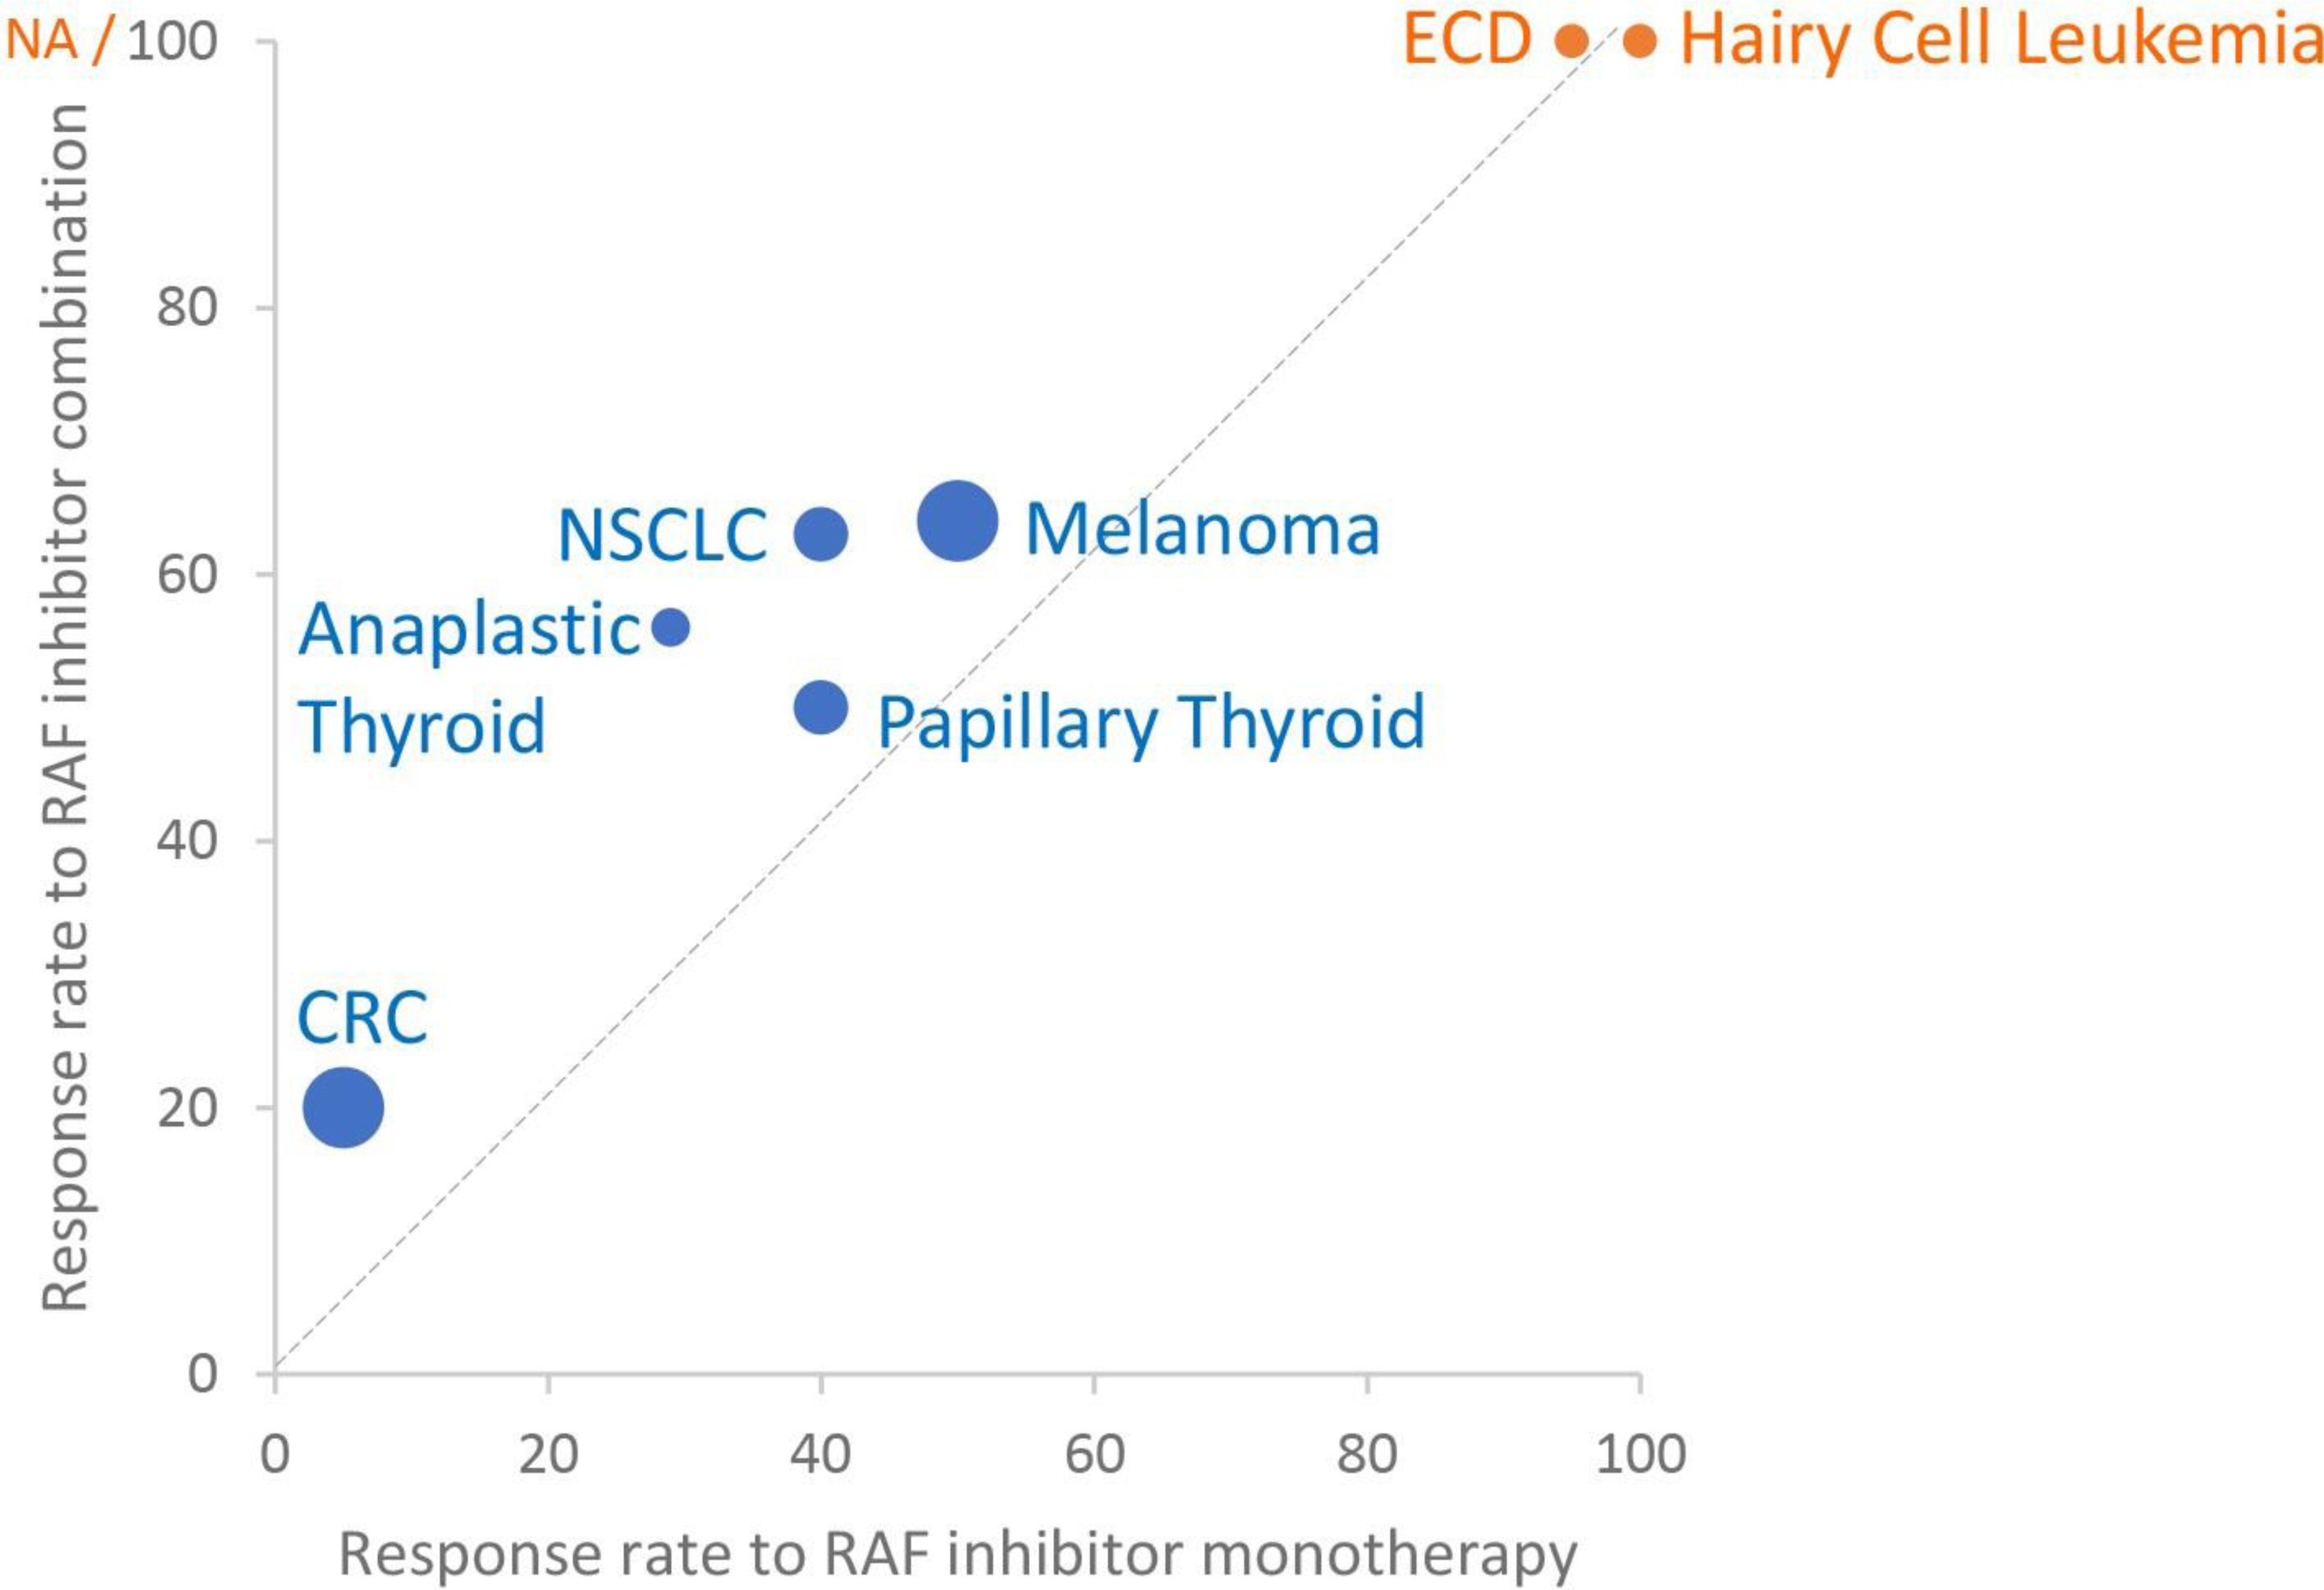
Figure 3: Response to RAF inhibitors across cancers.

Graph showing response to RAF inhibitor monotherapy or RAF inhibitor combination (RAF and MEK inhibitors or, for colorectal cancer, RAF and EGFR inhibitors). Disease types without reported combination trial data are indicated in orange. Size of data points corresponds to number of trial patients used to estimate response: smallest points (1–50 patients), middle sized points (51–100 patients), large points (>200 patients). Graphed response rate for ECD corresponds to PET response. CRC: colorectal cancer. ECD: Erdheim Chester Disease. NSCLC: non-small cell lung cancer. PANC: pancreatic cancer. NA: not accessed.
