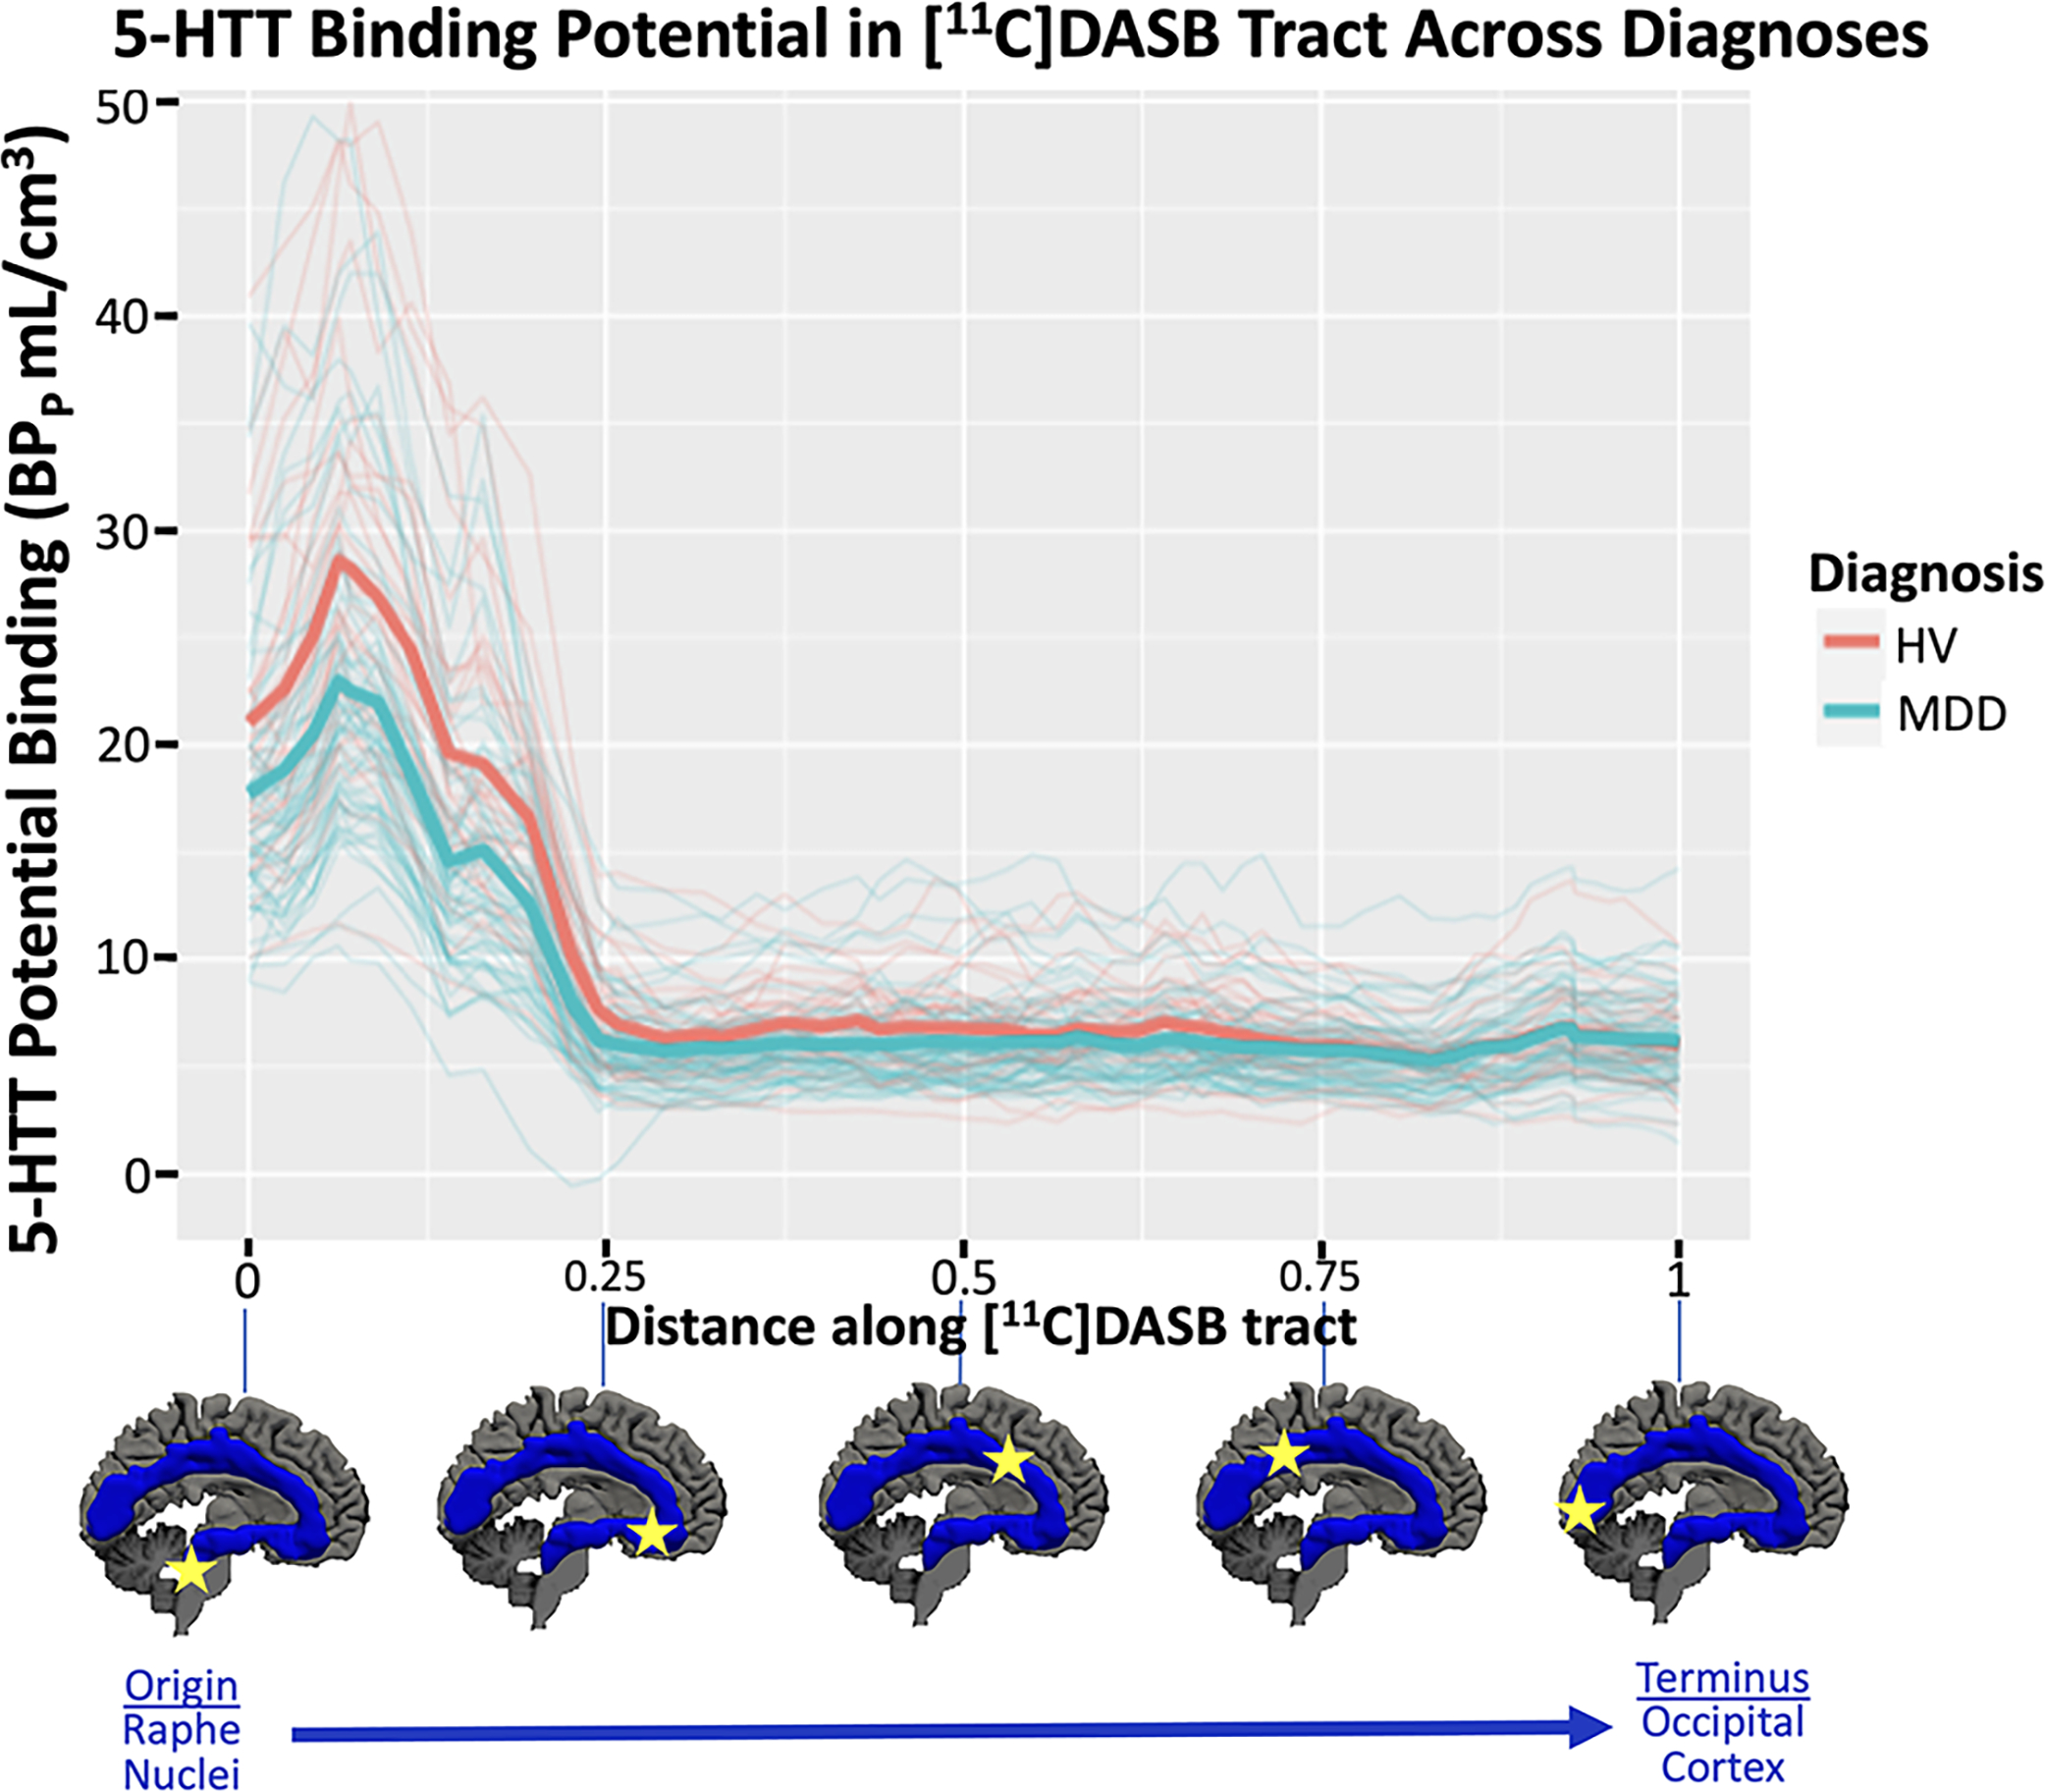
Figure 2:

Mean [11C]DASB binding potential BPP (y-axis) in each of the 56 parcels within the serotonin axon tract plotted as a function of distance from the origin of the tract in centimeters. Diagnostic group averages plotted in thick, bold lines with HV = healthy volunteer in pink and MDD = major depressive disorder in blue. Additionally, spaghetti plots of each participant are plotted with thin lines according to their group designation. Below plot is a depiction of the x-axis regions according to their location on the tract.
