
Figure 3:
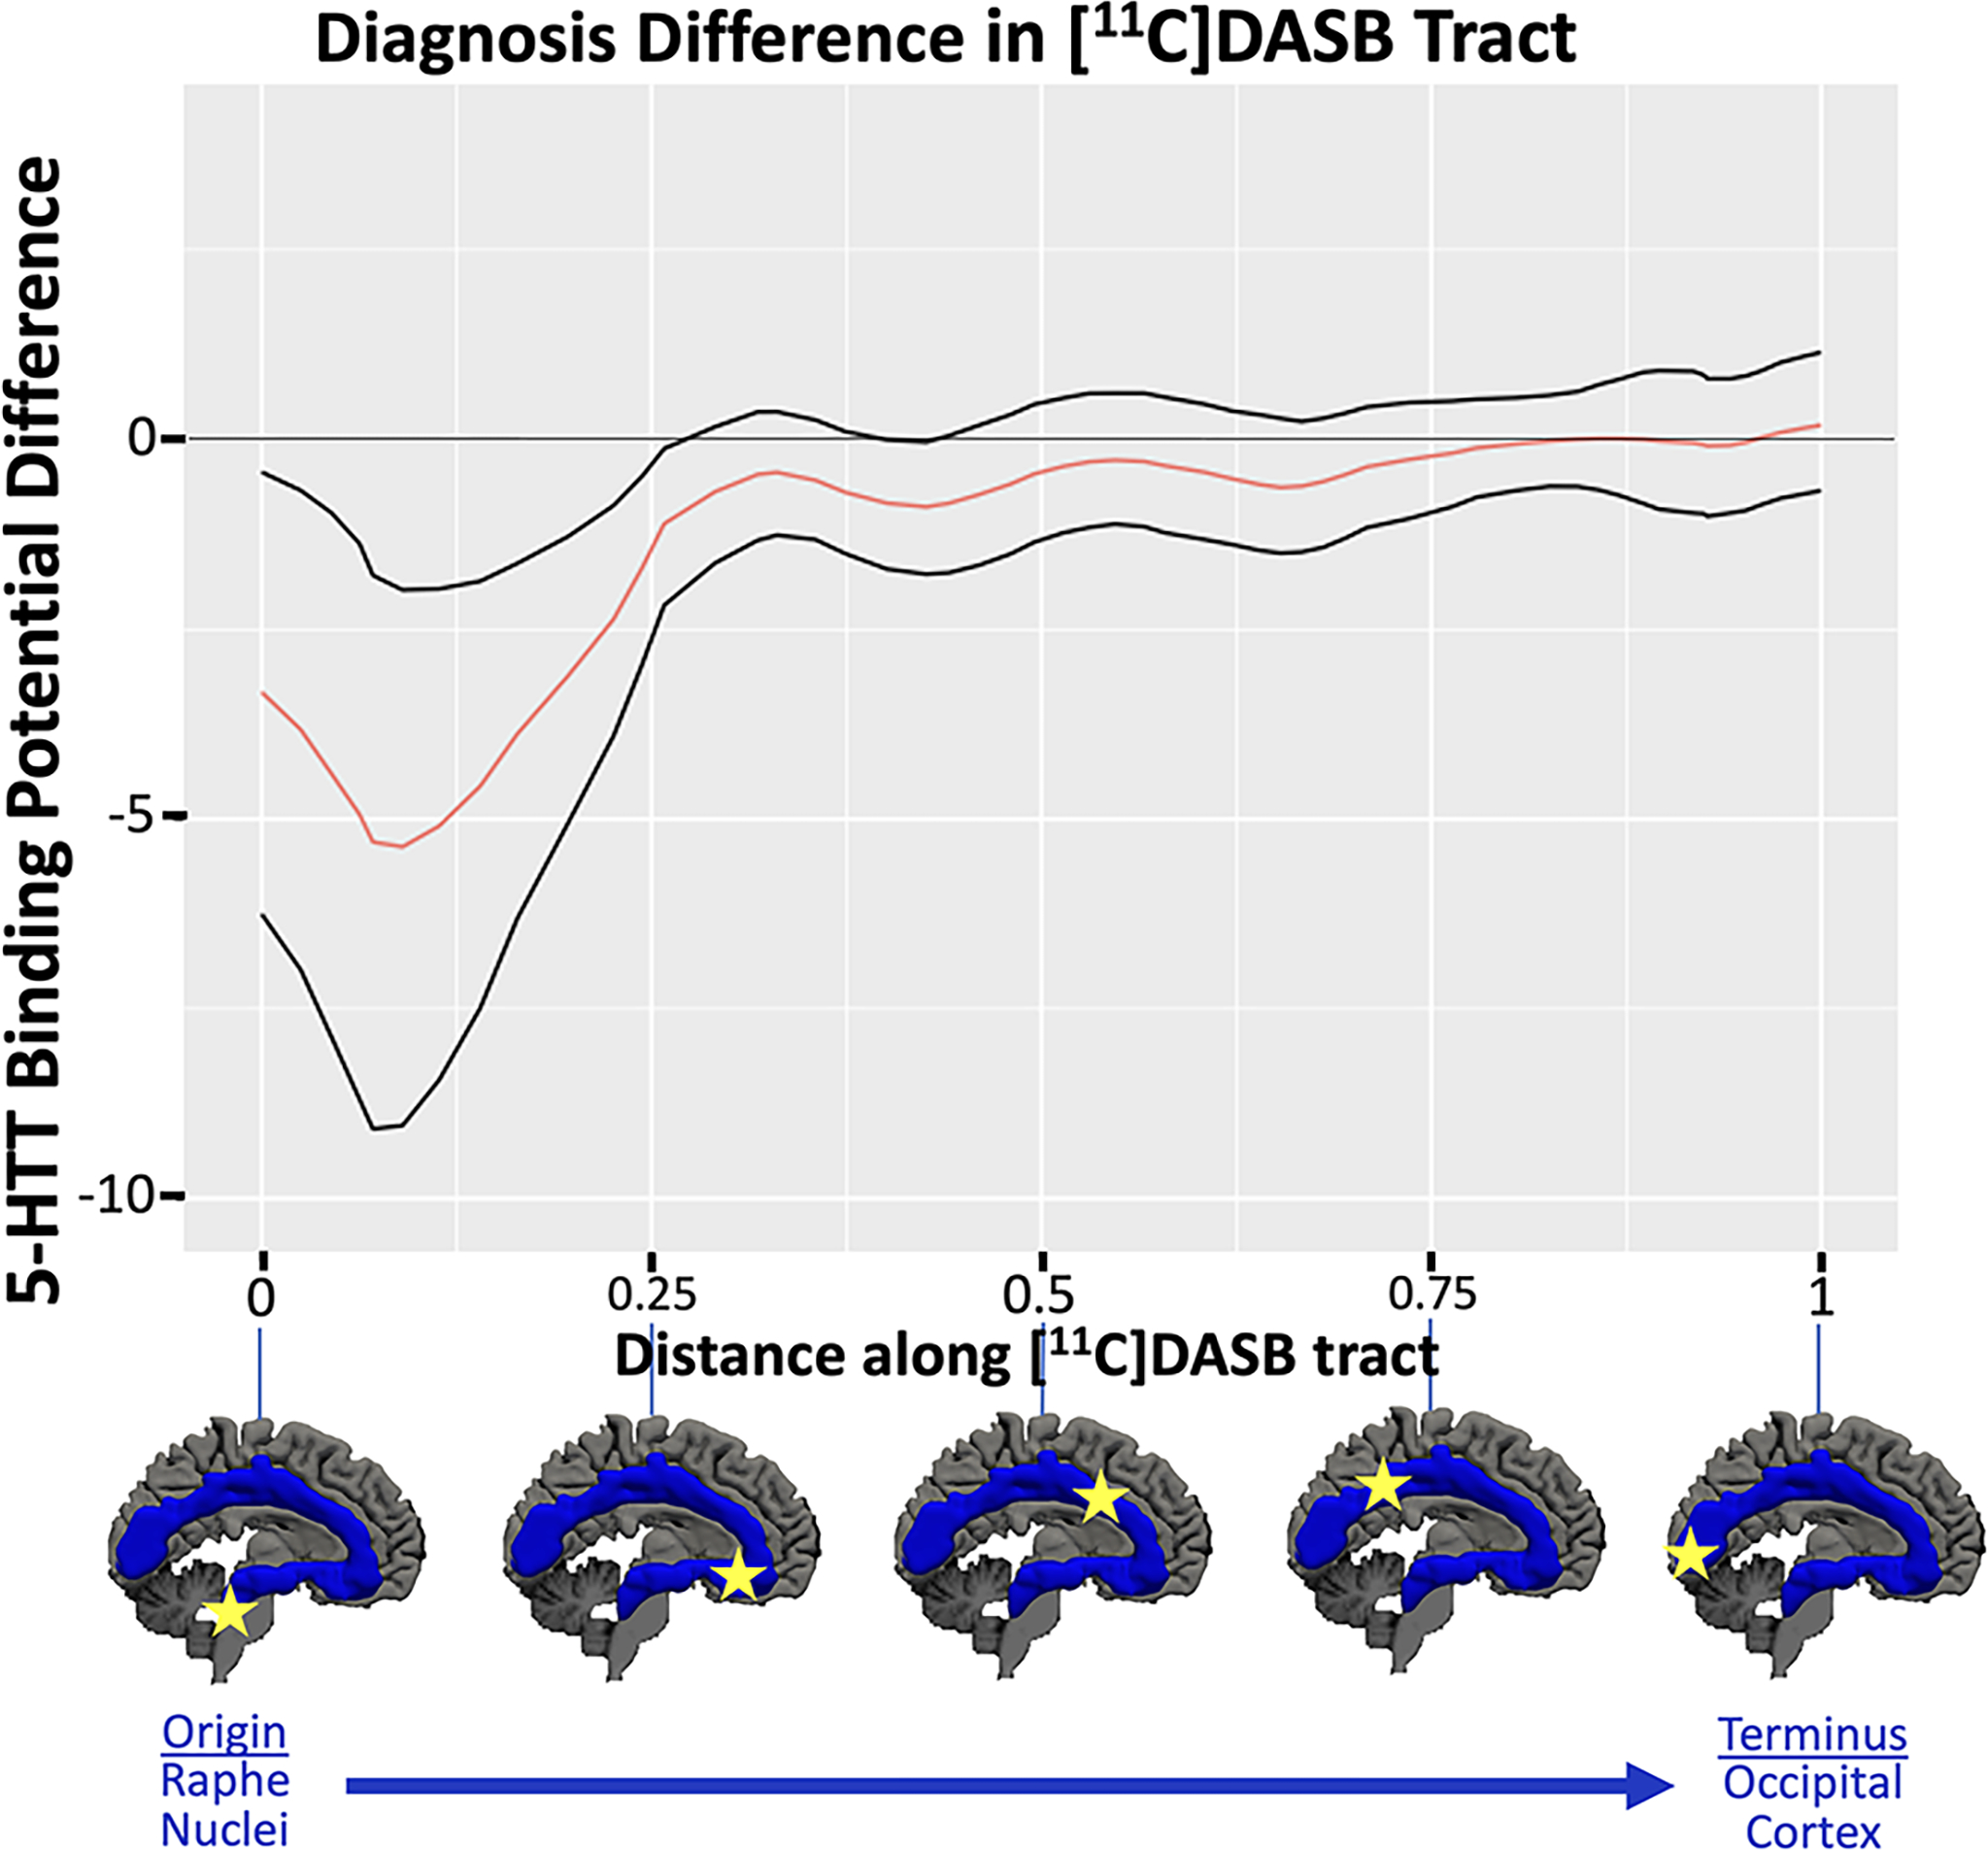
Diagnostic group difference test: The estimated difference in 5-HTT BPP between MDD = major depressive disorder and HV = healthy volunteer groups is shown plotted against the distance along the tract. The group difference in the original dataset is plotted with a thick, solid red line. Permutation testing, examining the area under the curve for the main effect of diagnostic group yielded a p-value of 0.02. Black lines show the 95% confidence intervals obtained via bootstrapping. Locations along the tract with both confidence intervals above or below 0 indicate locations of significant group differences.