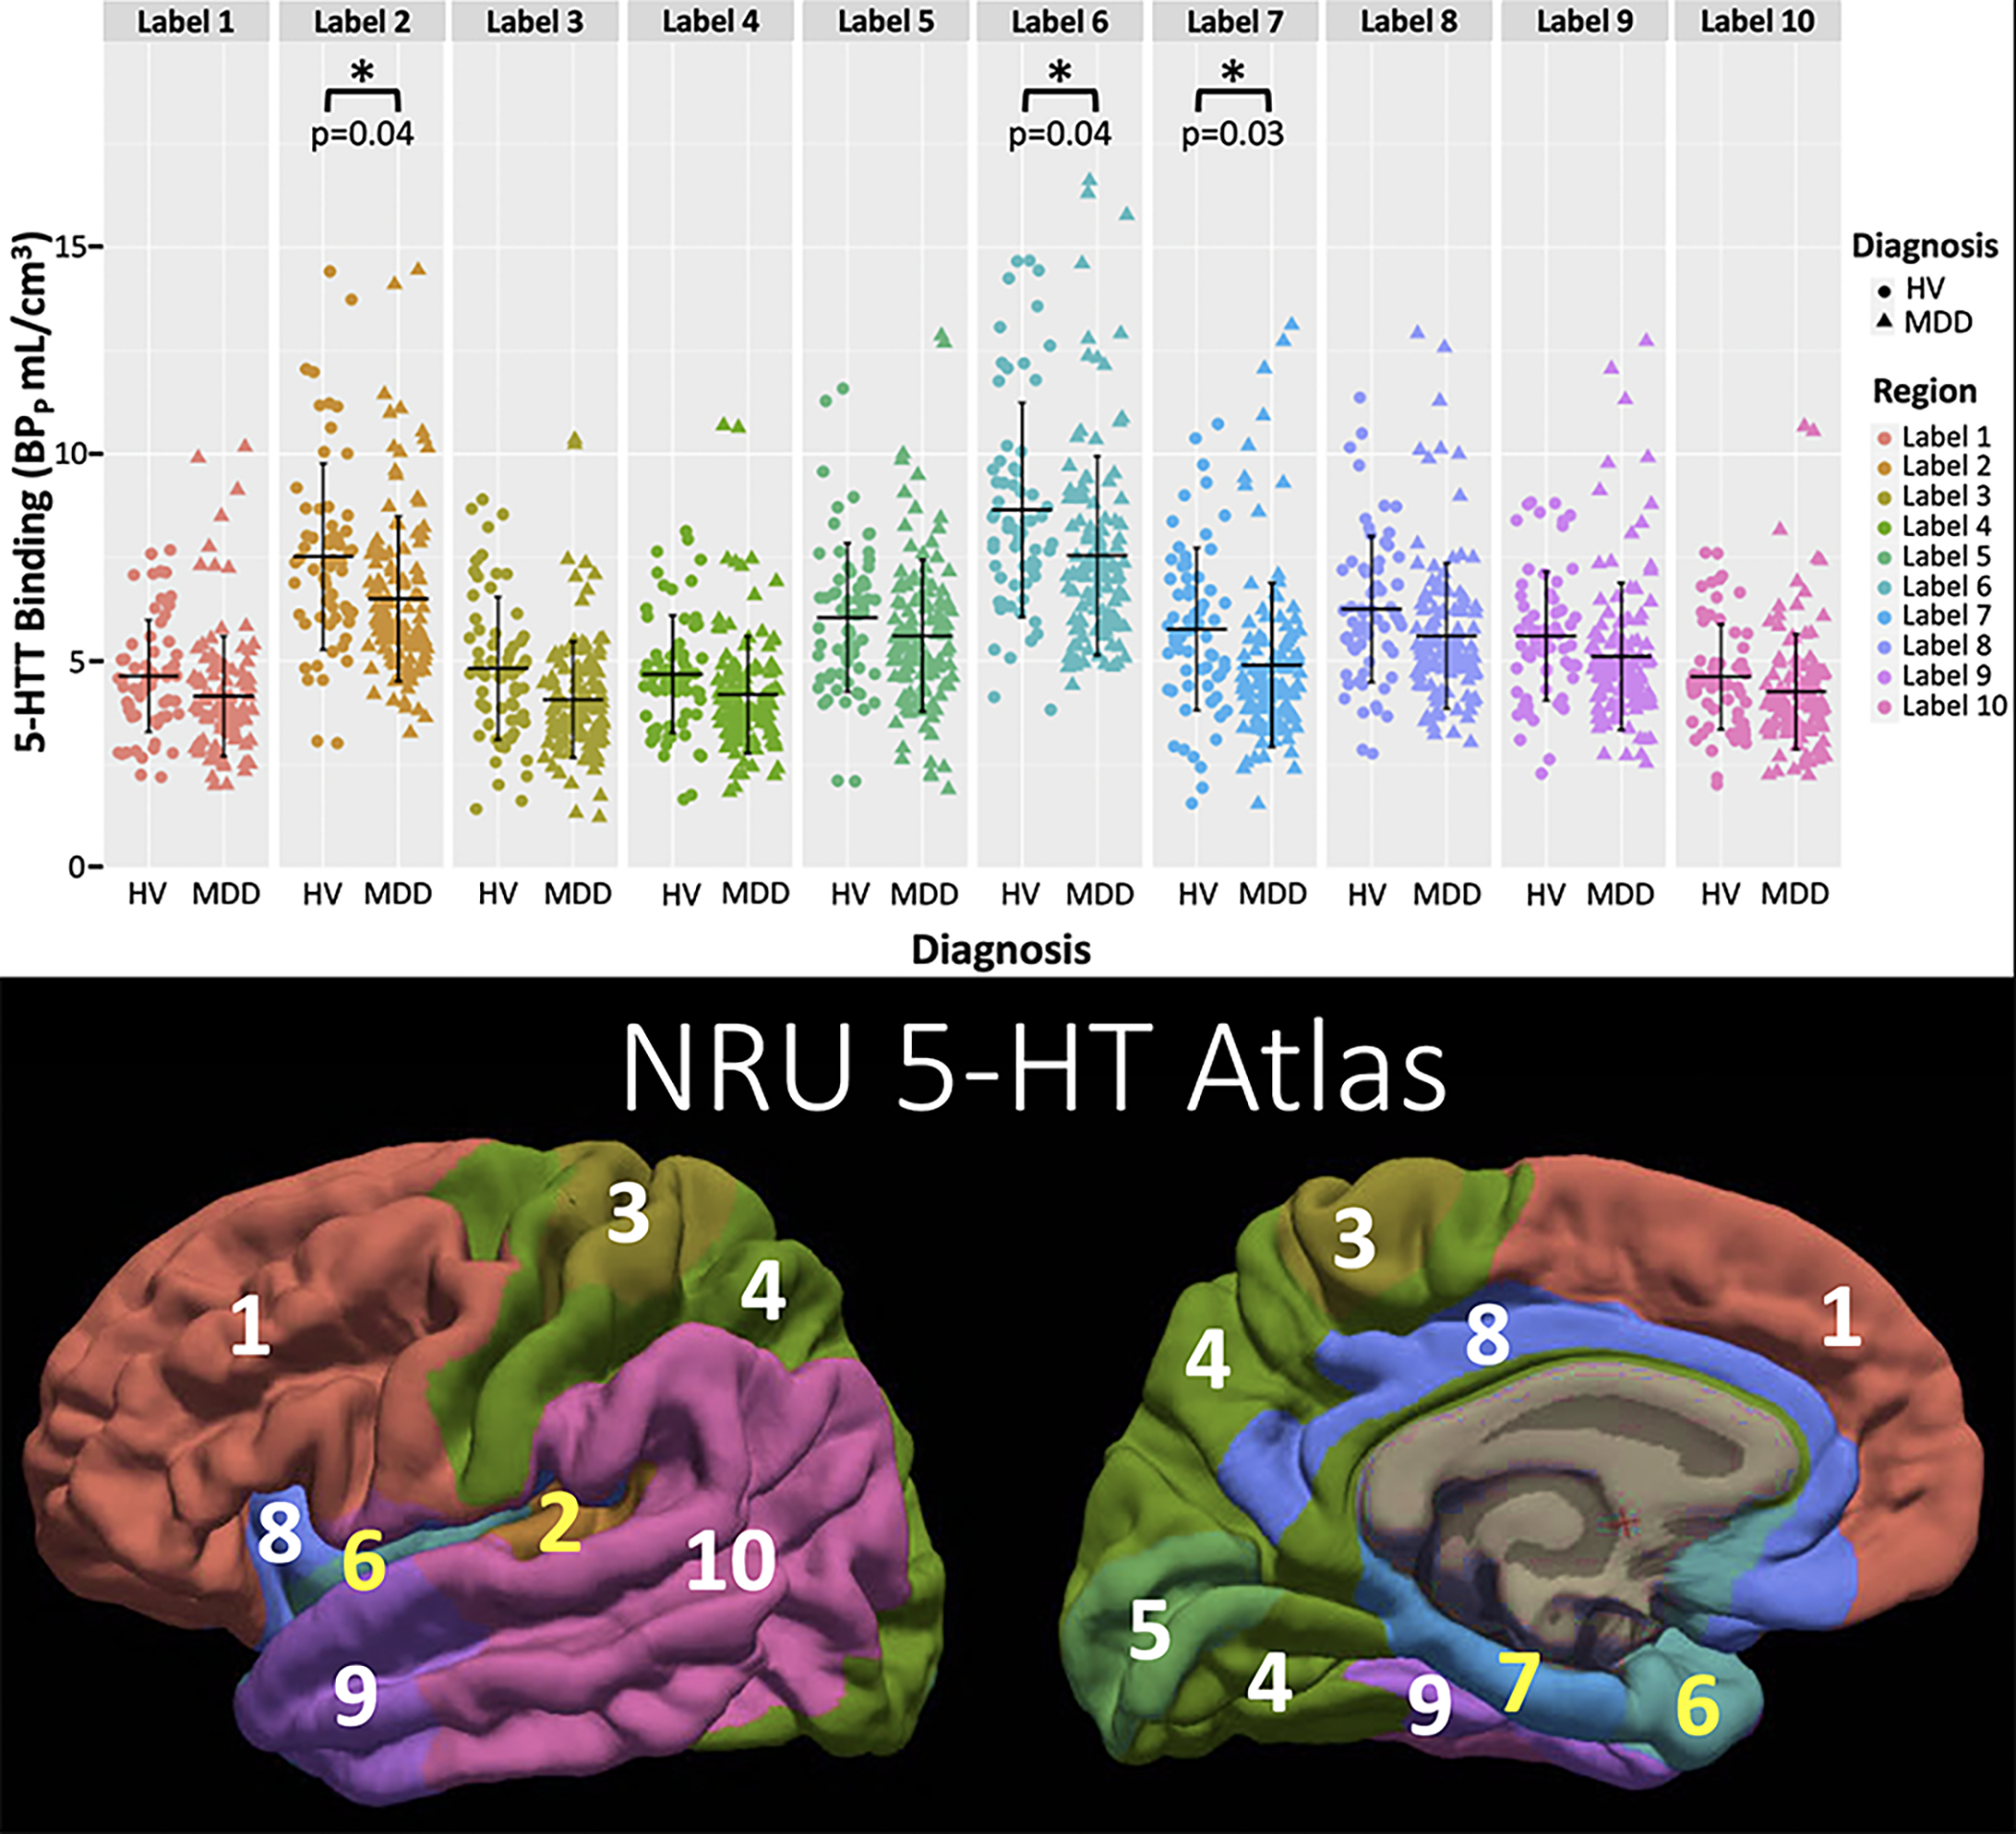
Figure 4:

Displaying the estimated lower 5-HTT binding potential in MDD relative to the HV group found within the NRU 5-HT Atlas, where 5-HTT binding potential (BPp) is plotted for all regions in the NRU 5-HT Atlas, broken down by diagnosis (HV=healthy volunteer with circles, MDD = major depressive disorder with triangles) (top). Regions with p<0.05 in post hoc analysis denoted with * and p-value is shown. The color-coding for each region in the top graph matches the corresponding region in the NRU 5-HT Atlas shown at bottom with labeling for region number.
