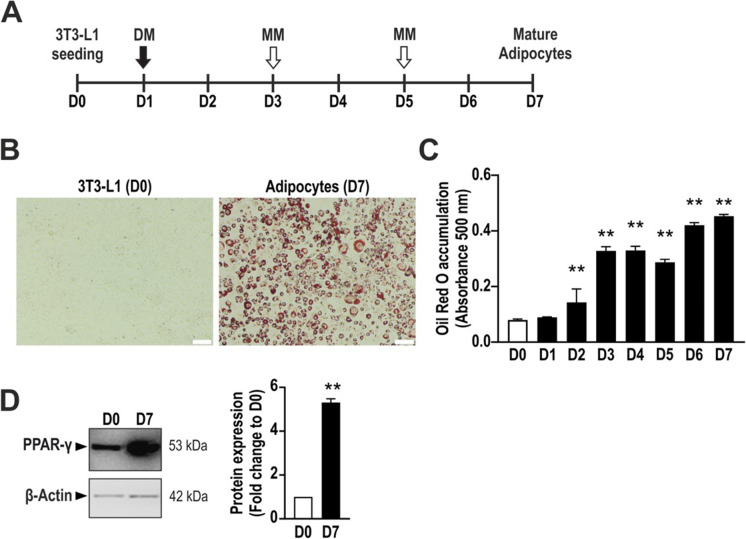
Fig. 1.
Adipogenesis process in 3T3-L1 cells. A Schematic overview of the differentiation process in 3T3-L1 cells. B Representative picture showing non-differentiated 3T3-L1 cells (D0) and adipocytes (D7) stained with Oil Red O. C Daily quantification of Oil Red O accumulation by measuring its absorbance at 500 nm with a plate reader. **p < 0.01 compared to day 0. D Representative immunoblot showing the expression of the adipocyte marker PPAR-γ and its densitometry analysis. β-Actin was used as loading control. D0: day 0 (non-differentiated cells); D7: day 7 (mature adipocytes). DM, differentiation medium; MM, maintenance medium. Data refer to mean values of N = 5 independent experiments ± SEM. **p < 0.01 shows significant Oil Red O accumulation on days 2–7 compared to day 0 control or significant PPARγ expression on day 7 compared to day 0 control

