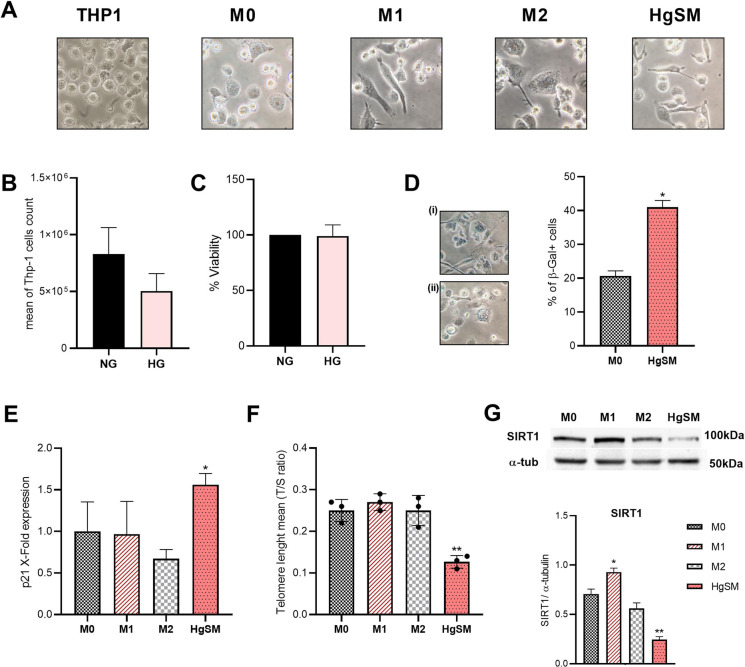
Figure 3.
Analysis of PMA-induced macrophage phenotypes and senescent features in HgSMs. A Representative pictures from THP-1 cells and M0, M1, M2, and HgSM macrophage polarization observed by light microscopy (40×). B THP-1 proliferative activity in hyperglycemia compared to normoglycemia. C THP-1 viability in hyperglycemia compared to normoglycemia performed by MTT assay. D SA-β-Gal activity of HgSMs (i) compared to M0 (ii). E p21 qRT-PCR analysis in M0, M1, M2, and HgSMs. F Measurements of telomere length (T/S ratio) in M0, M1, M2, and HgSM macrophages. G Representative immunoblot and quantification of SIRT1 expression in M0, M1, M2, and HgSM macrophages. Data are expressed as mean ± SD, *p≤0.05; **p≤0.01; ***p≤0.001

