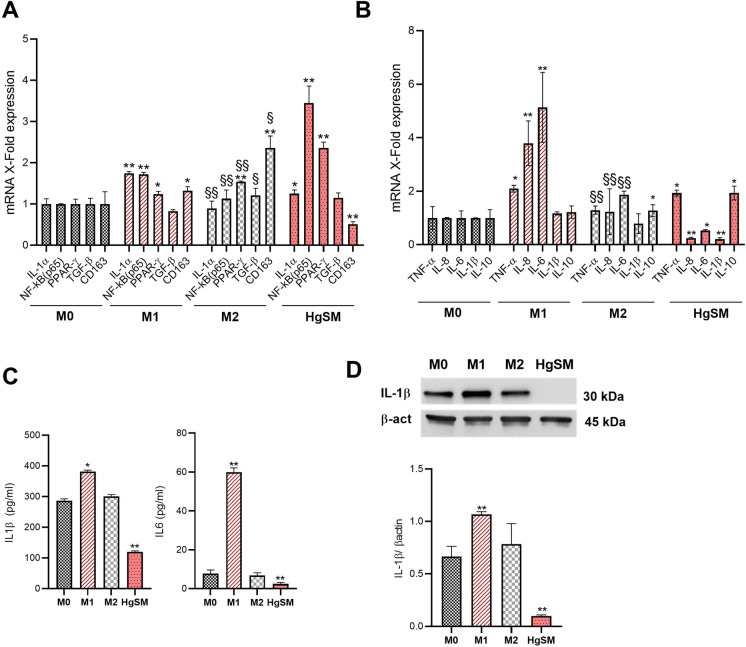
Figure 4.
Phenotypic characterization of HgSM macrophages. A qRT-PCR analysis of NF-kB, Il-1a, TGF-b, PPAR-g, and CD163 expression in macrophages. B qRT-PCR analysis of TNF-α, IL-8, IL-6, IL-1β, and IL-10 expression in macrophages. C IL-1β and IL-6 concentration (pg/ml) measured by ELISA in the cell culture supernatants. D Representative immunoblot and quantification of IL-1β expression in M0, M1, M2, and HgSM macrophages. Data are expressed as mean ± SD, *p≤0.05; **p≤0.01; ***p≤0.001; §p≤0.05; §§p≤0.01; §§§p≤0.001. *vs M0, §vs M1

