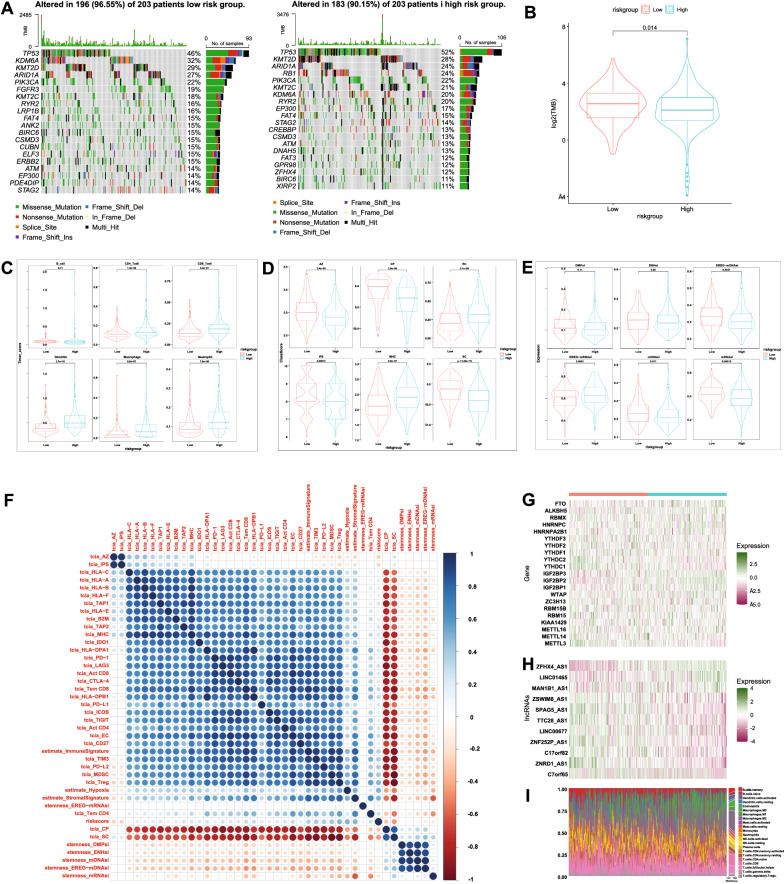
Fig. 4.
Comparisons between high-risk group and low-risk group. A The oncoplots of two risk subgroups showing significant mutation rate difference in some commonly mutated genes in bladder cancer. B Tumor mutation burden in the low-risk group was higher than that in the high-risk group(p < 0.05). C Higher Immunophenoscore in low-risk group indicates that the patients in low-risk group might have stronger immunogenicity and might be more sensitive to immunotherapy. D All types of infiltrating immune cells in high-risk group were more abundant than those in the low-risk group as calculated using the TIMER algorithm. E Low-risk group showed higher stemness indices than high-risk group. F Correlation matrix showing the relationship between risk score and immune factors. G–I 21 m6A regulator expression pattern (G), 11 m6A-immune-related lncRNAs expression pattern (H), and CIBERSORT immune infiltration pattern (I)

