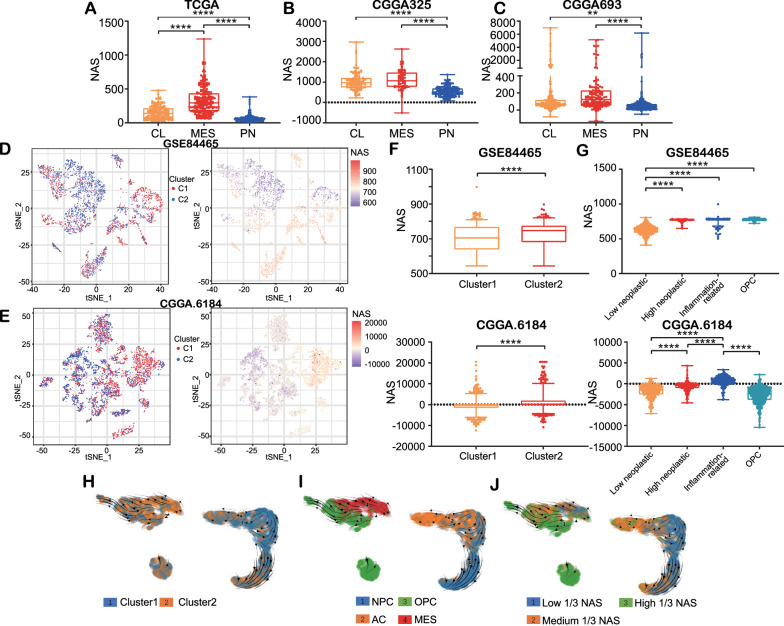
Fig. 2.
The NAS is positively correlated with glioma aggressiveness. A–C Distribution of NAS in samples grouped by Verhaak classification in TCGA, CGGA325, CGGA693, respectively. D, E Distribution of clusters and NAS in GSE84465 and CGGA dataset, respectively. The cells are displayed by tSNE reduction. F The NAS of cluster1 and cluster2 in GSE84465 and CGGA dataset, respectively. G The NAS of four cell types, low neoplastic, high neoplastic, inflammation-related glioma cells and OPC in GSE84465 and CGGA scSeq datasets, respectively. H–J The RNA velocity of GSE84465 displayed by clusters, subtypes and NAS, respectively

