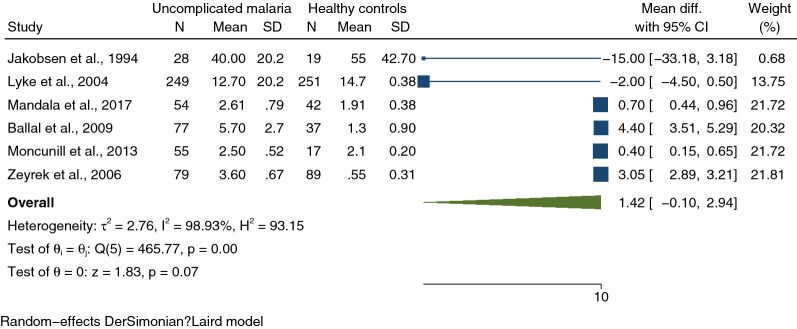
Fig. 4.
Forest plot demonstrating pooled MD of IL-1β levels (pg/mL) between uncomplicated and healthy control participants. The x-axis of the forest plot is on a logged scale 0–10, black x-axis line; the squares’ centres and the values of the study’s effect sizes in logged scale; green diamond; I2, H2, τb2, heterogeneity measures; under the green diamond: the test of I also known as the homogeneity test, is based on the Q statistic; the test of θ, the overall magnitude of the effect. CI confidence interval, Mean Diff. mean difference, SD standard deviation

