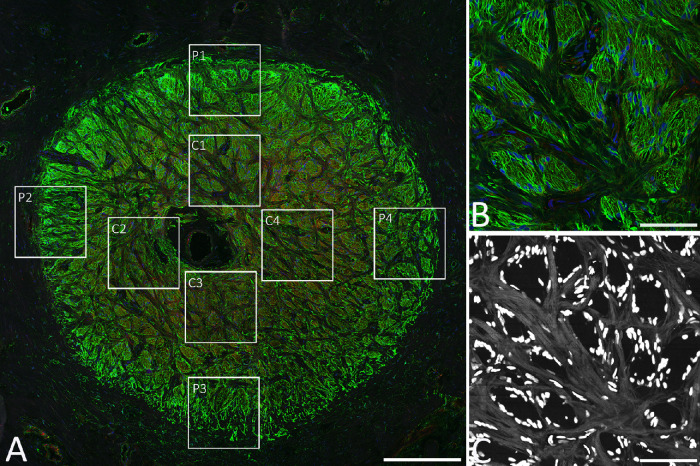
Figure 2.
(A) Typical optic nerve LC cross-section labeled for GFAP (green), phalloidin/F-actin (red), and DAPI (blue) that provided a map to locate the eight locations for quantification, four centrally and four peripherally. (B) Representative image of GFAP label from a central LC location (region C1 in A). (C) Second harmonic generation image of region C1 showing beam structure (gray) and nuclei (white). Scale bars: 500 µm (A) and 100 µm (B, C).

