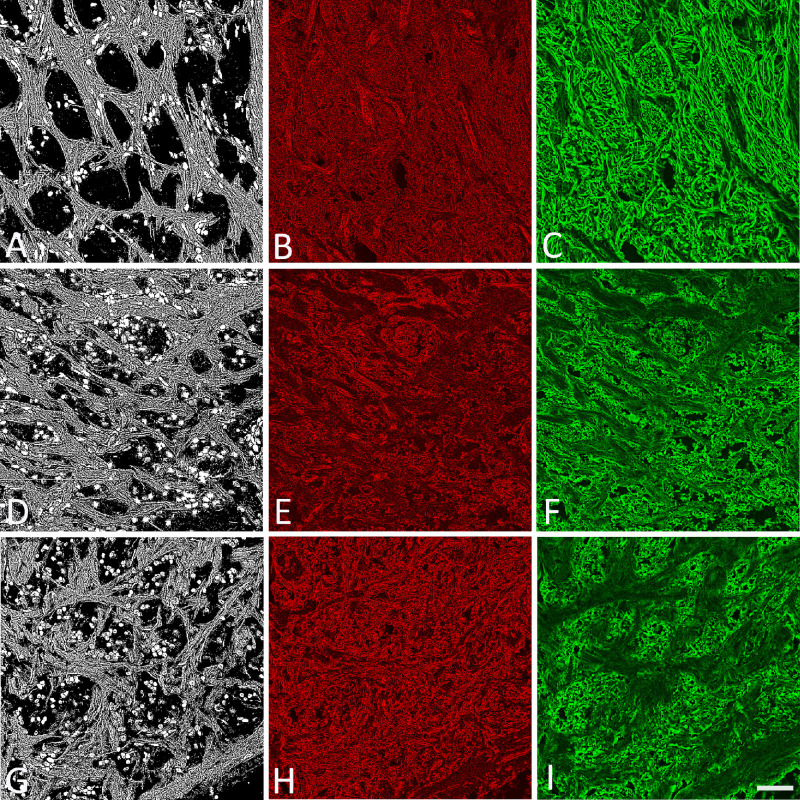
Figure 5.
Control (A–C) and glaucoma (D–H) LC, imaged by SHG (A, D, G) and with labels for F-actin (B, E, H) and GFAP (C, F, I). Compared to control (A–C), the examples with moderate glaucoma damage (D–F) and severe glaucoma damage (G–I) show nuclei more prevalent in pores (white ovals in left column images). In addition, the pattern of F-actin and GFAP labeling is changed in the moderate and severe glaucoma specimens. Scale bar: 50 µm.

