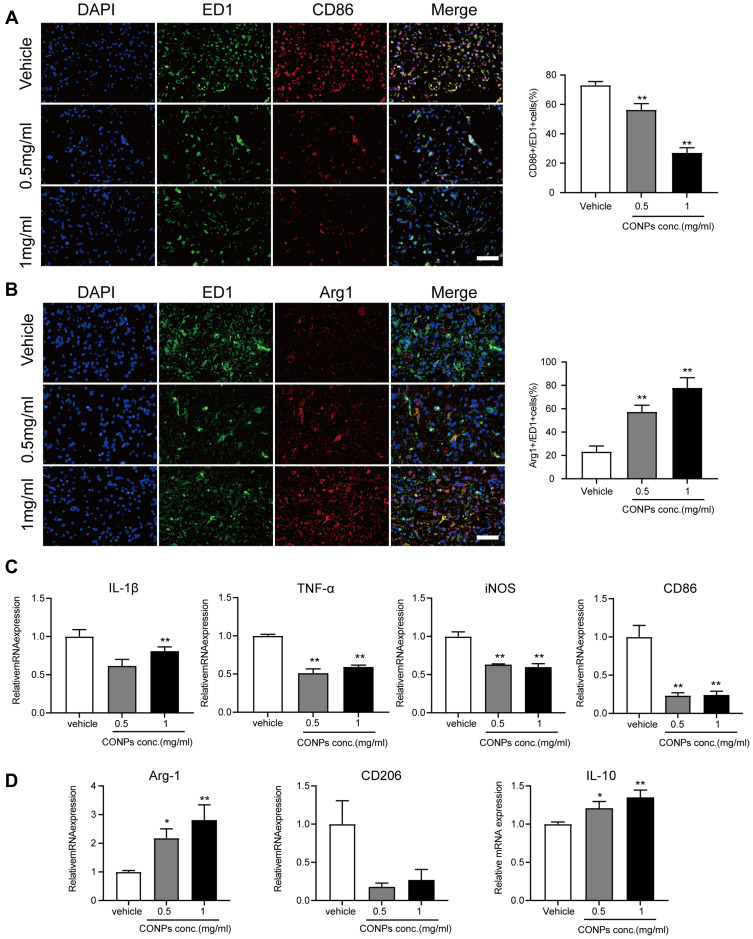
Figure 4.
CONPs treatment promoted M2 macrophage polarization. (A and B) Representative immunofluorescence image of macrophage phenotype distribution after CONPs treatment (left, n = 12 each group). Scale bar = 50 μM. M1 macrophages positive for CD86 (red) and M2 macrophages positive for Arg1 (red). Cells were co-stained with pan macrophage markers (ED1, green). Statistical analysis showed CONPs injection significantly increased the percentage of Arg1+/ED1+ cells while decreasing that of CD68+/ED1+cells (right). (C) Gene expression analysis of M1-related markers by qRT-PCR (n = 5 each group). (D) Gene expression of M2-related markers by RT-qPCR (n = 5 each group). The data were shown in mean ± standard deviation. P < 0.05 was set as significance. Compared with the vehicle group, *P < 0.05, **P < 0.01.

