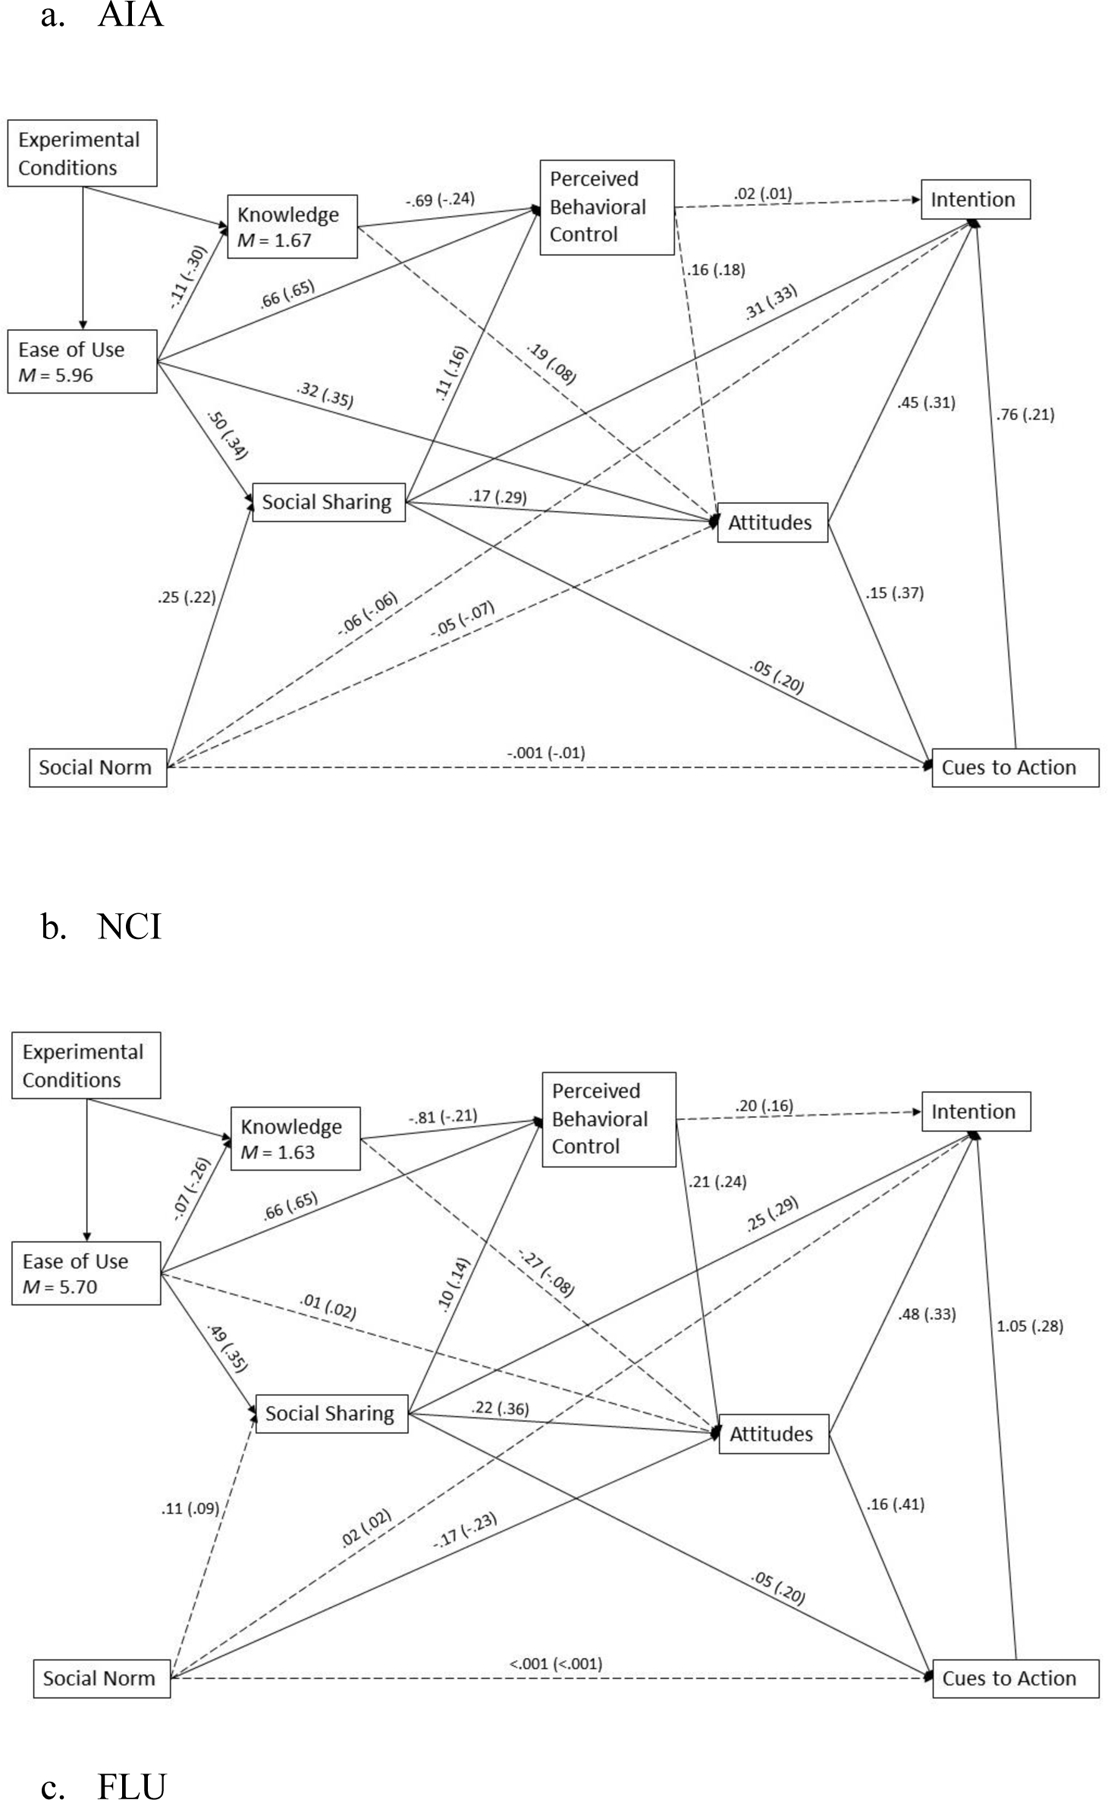
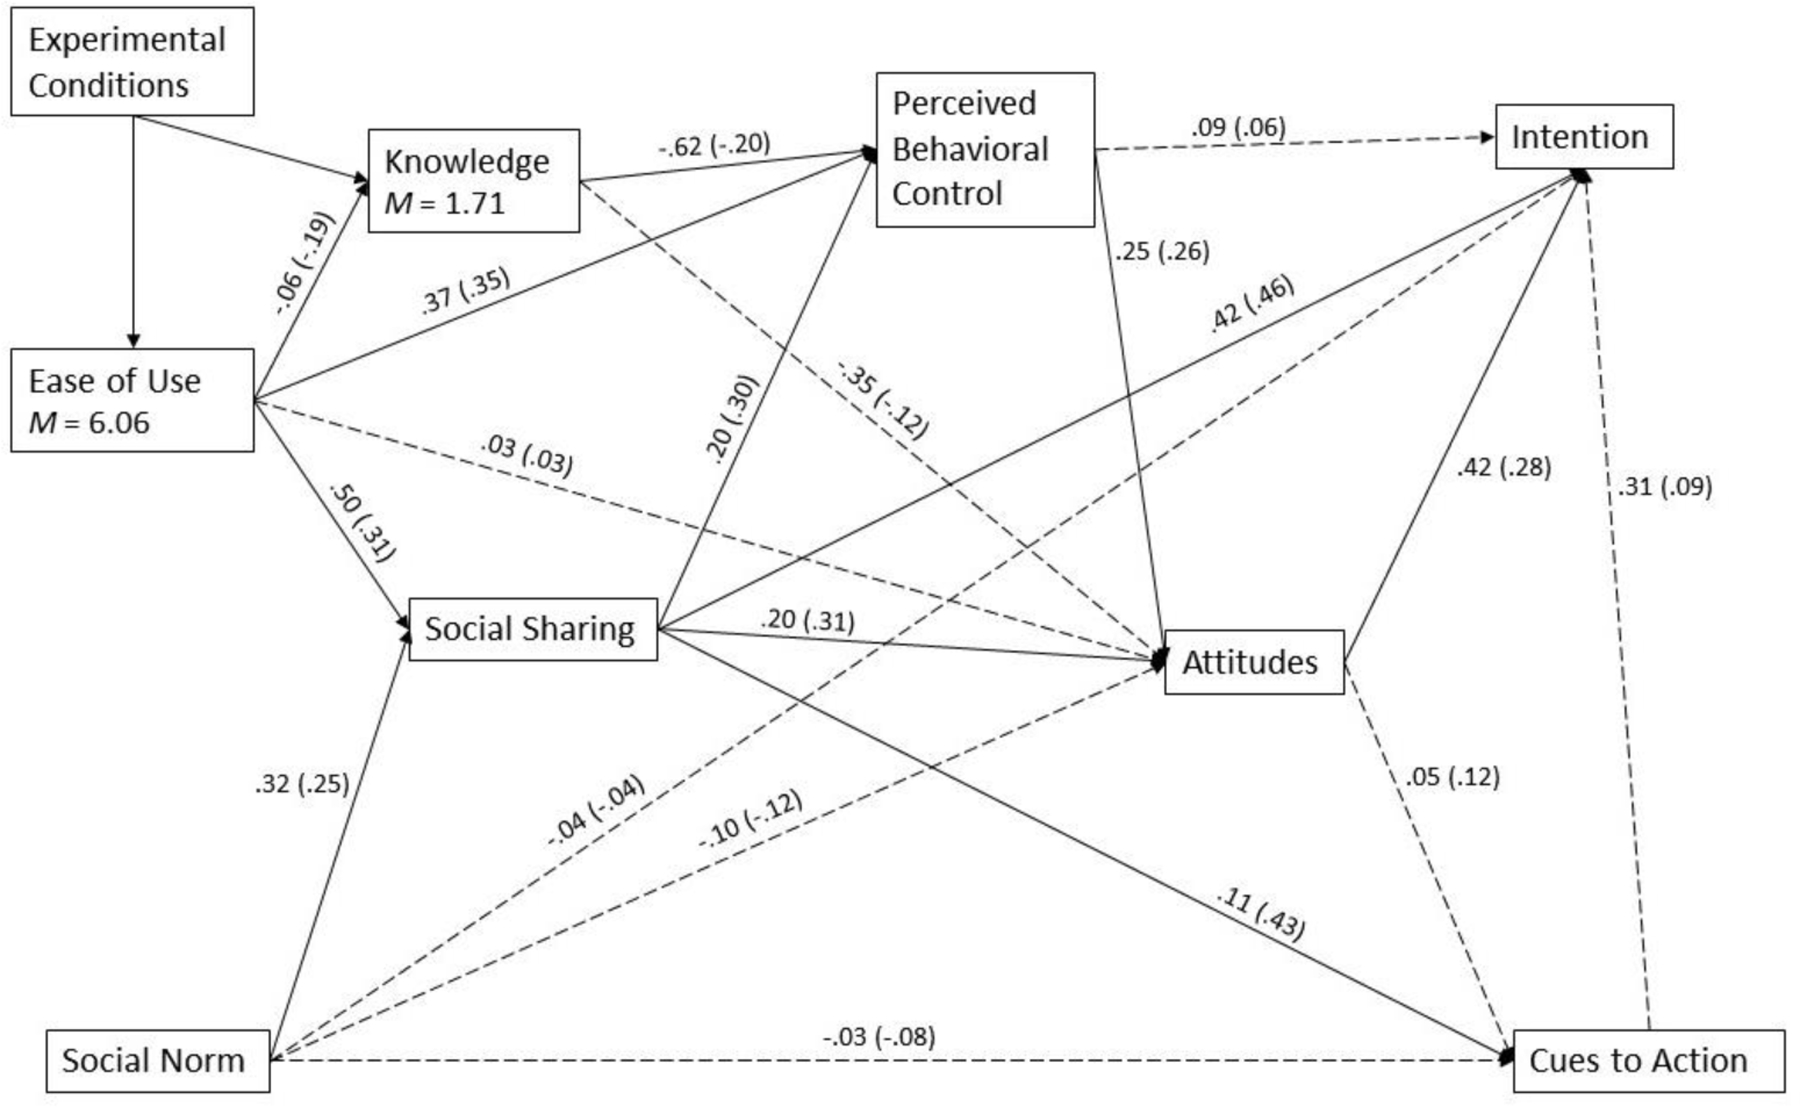
Figure 2.


Results of the Path Model of Three Experimental Conditions (AIA, NCI, and FLU; N = 460)
Note: All solid paths are significant at .05 level. The coefficients outside parentheses are unstandardized. The coefficients inside parentheses are standardized. Results exclude a case of missing data.
