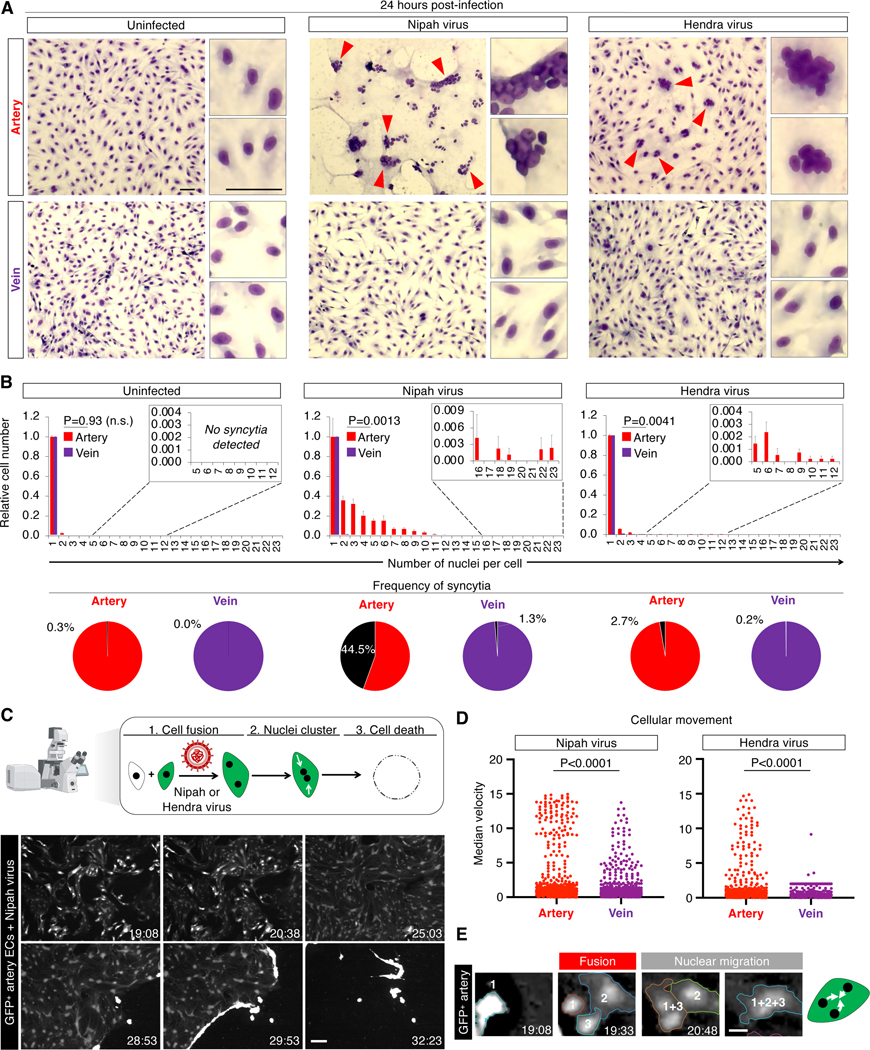
Figure 5: Nipah and Hendra viruses target artery cells.
A) Syncytia (arrows) in H1 hPSC-derived artery and vein ECs inoculated with Nipah or Hendra viruses for 24 hours; scale = 25 μm
B) Numbers of nuclei per cell after inoculation with Nipah or Hendra viruses for 24 hours (top); syncytia frequency (≥3 nuclei/cell; bottom)
C) Live imaging of cocultured SUN004.1.9 GFP+ and H1 wild-type artery ECs infected with Nipah virus, tracking cell fusion into GFP+ syncytia, followed by death (scale = 200 μm, timestamp: hours:minutes)
D) Live imaging showed Nipah- and Hendra-infected artery ECs displayed significantly greater median velocity (a measure of cell fusion) than vein ECs
E) Fusion and GFP diffusion between 3 Nipah-infected artery ECs, followed by aggregation of their nuclei (scale bar = 20 μm, timestamp: hours:minutes)

