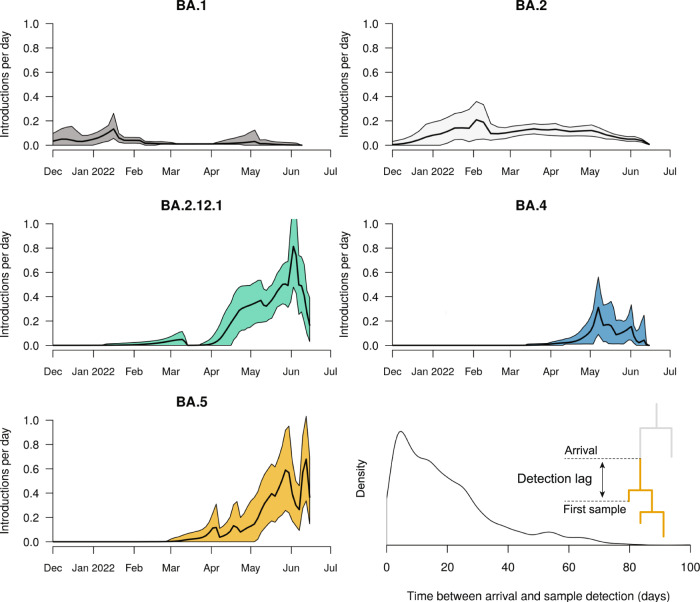
Fig. 5. Estimated arrival rate of Omicron subvariants into New Zealand.
Mean estimates (black line) and 95% credible intervals (shaded) are indicated. Bottom right: Lag time between when a lineage is estimated to have entered the community (i.e. an introduction), and when the first case is detected (i.e. sampling). The sample date is when the case tested positive, and not the date of genomic sequencing. The meaning of lag time is illustrated in the figure.

