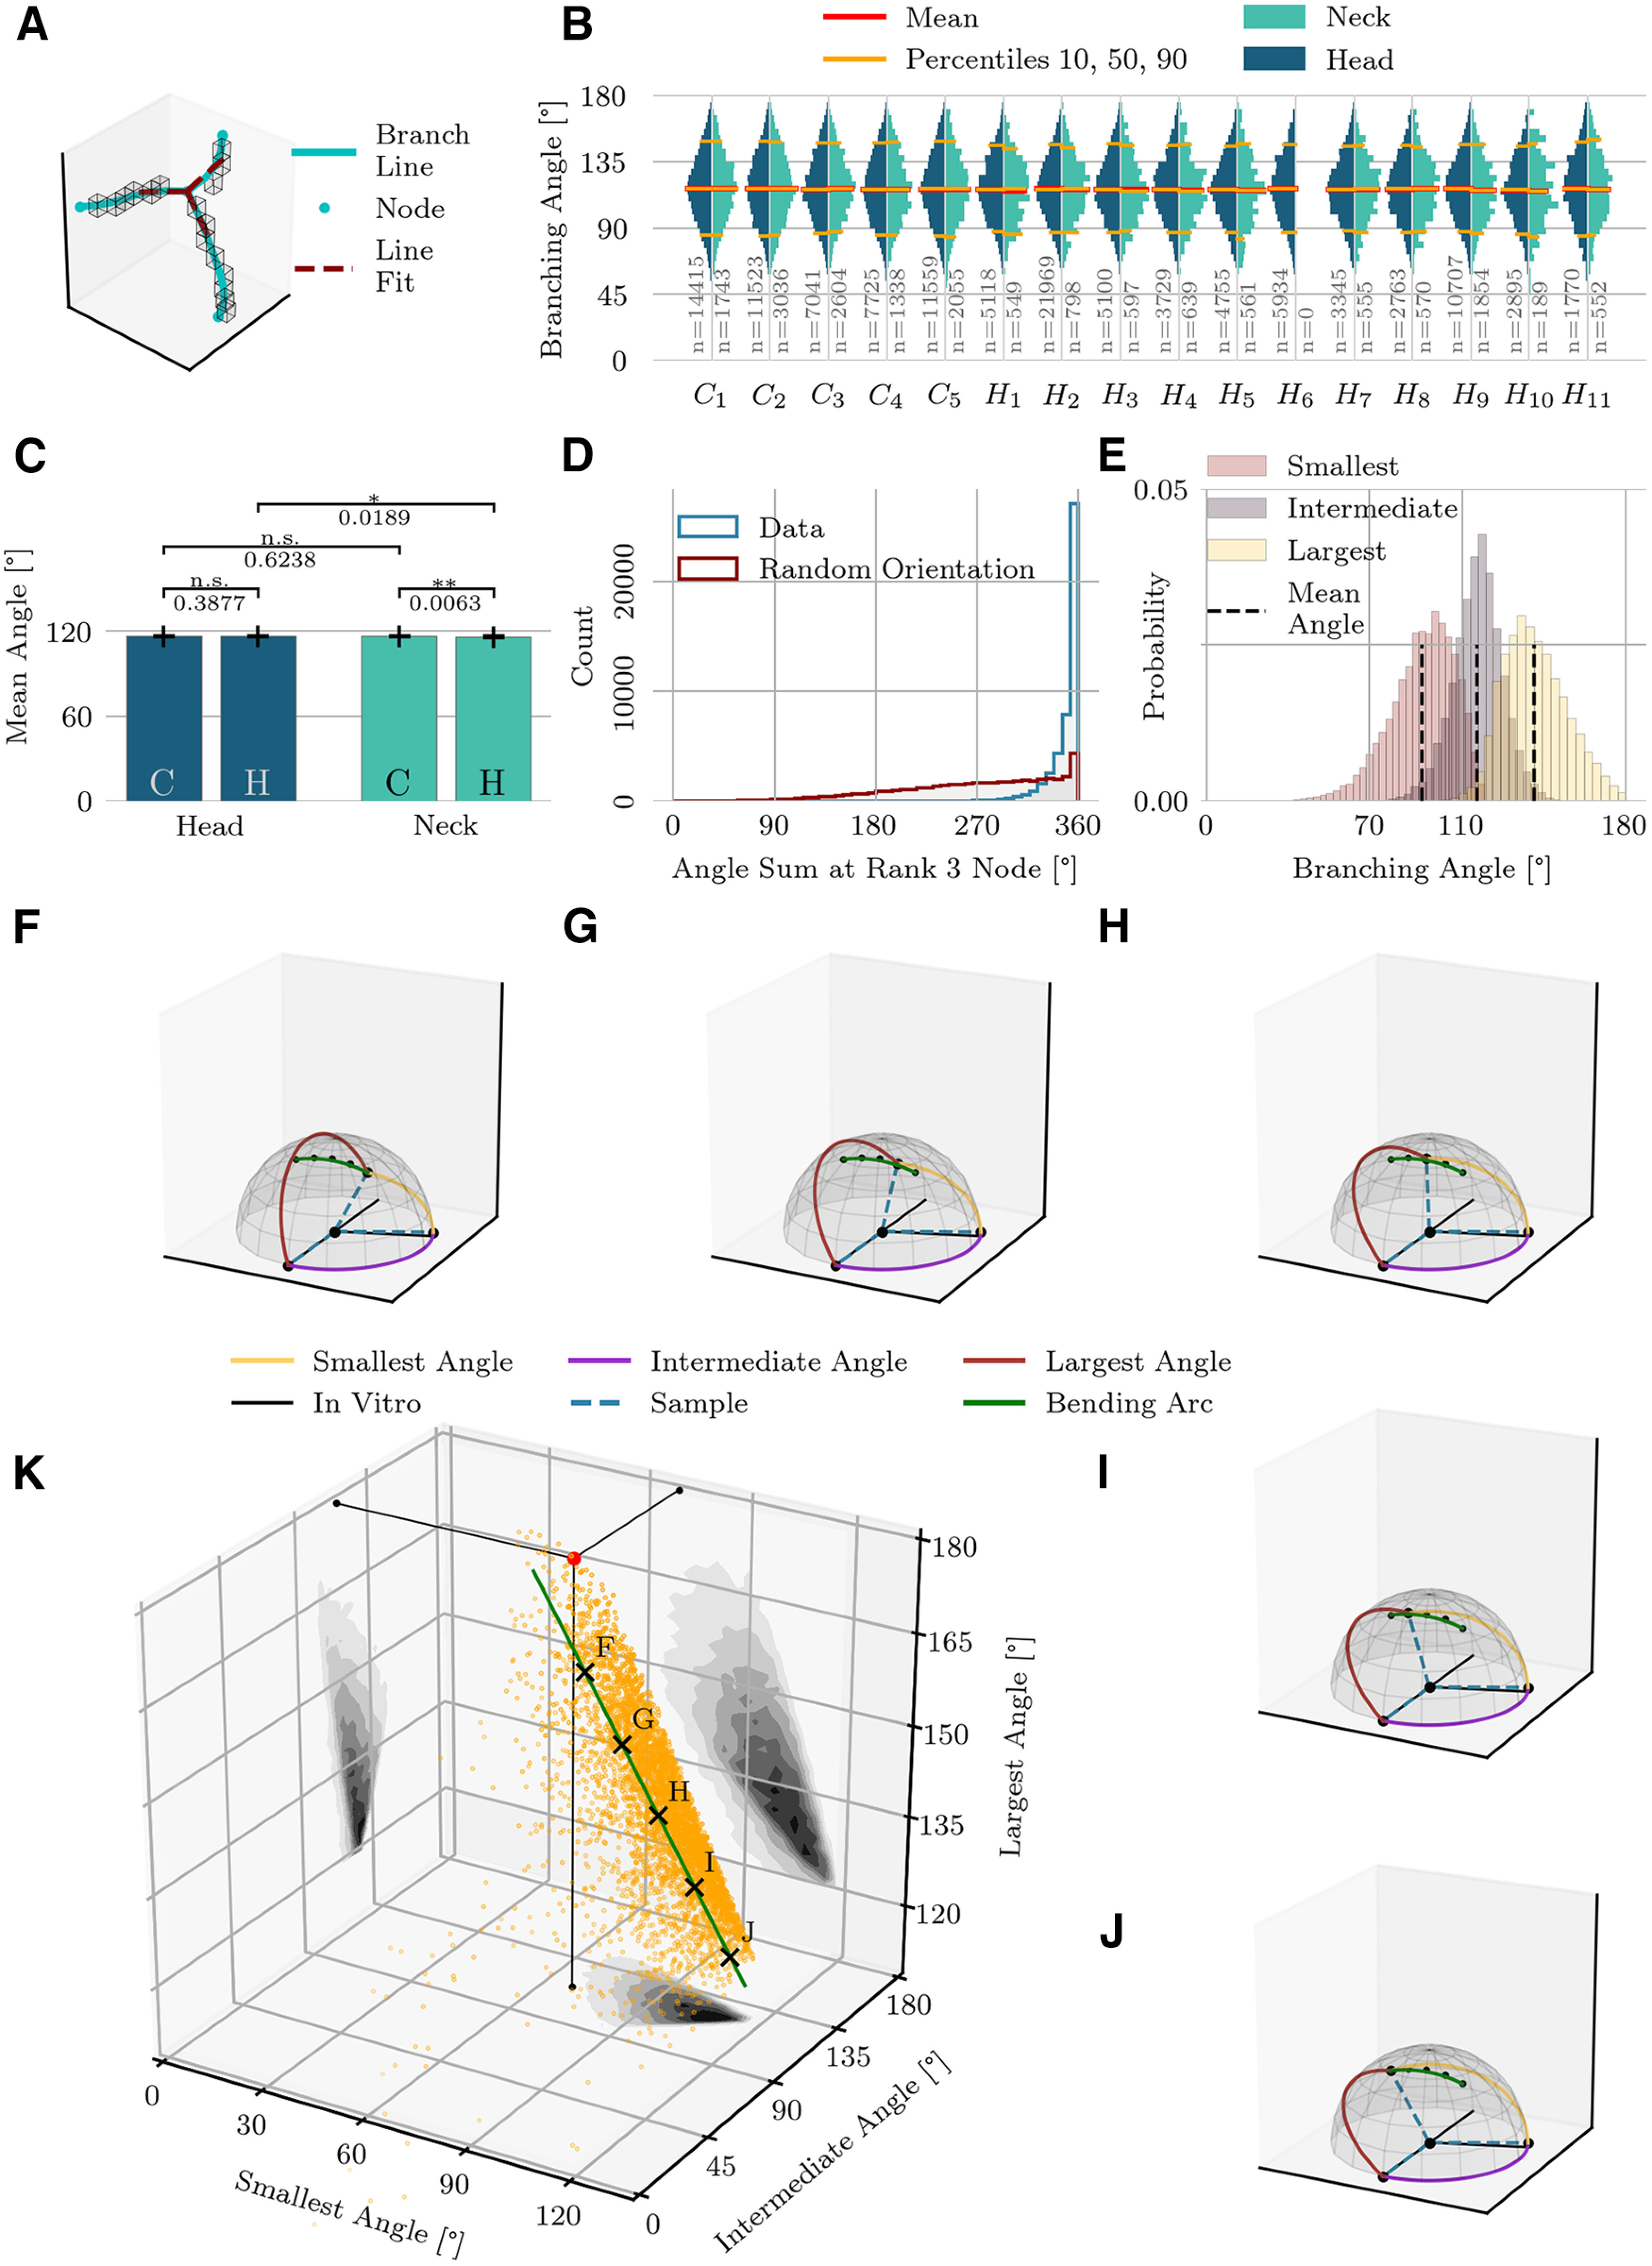
Figure 5.

Branching angles. A, Illustration of a rank-3 node. Voxels of topological skeleton are indicated by boxes. Smoothed branch lines are shown in blue. A line fit (red dotted line) approximates the orientation of the branches. The angles between the red lines represent the branching angles. B, Distribution of the branching angles of the entire population, shown separately for the head and neck regions. Sample sizes shown in gray. C, Pairwise comparison of mean branching angles. Bar plots show the mean and STD of average branching angles (mean and STD are computed on average values for individual spine domains). D, The sum of the three branching angles at a rank-3 node tends to be close to 360°, indicating that the branches nearly lie in a plane. When the branching angles are random, in contrast, the sum of angles is often lower. E, Distributions of angles at rank-3 nodes, shown separately for smallest, intermediate and largest angles. Mean angles deviate from in vitro actin branching angles. F–J, Branching patterns at the points indicated by matching letter labels in K. A 70°−110°−180° branching-pattern is shown for comparison by the black solid lines. The intermediate angle (110°) remains fairly stable across these examples, while a single branch changes its position as indicated by the green arc. K, 3D distribution of the three measured branching angles at rank-3 nodes. The red dot indicates the planar 70°−110°−180° model that corresponds to in vitro actin branching. The first principal component of this distribution, representing 57% of the total variance, is shown as a green line segment.
