
Figure 6.
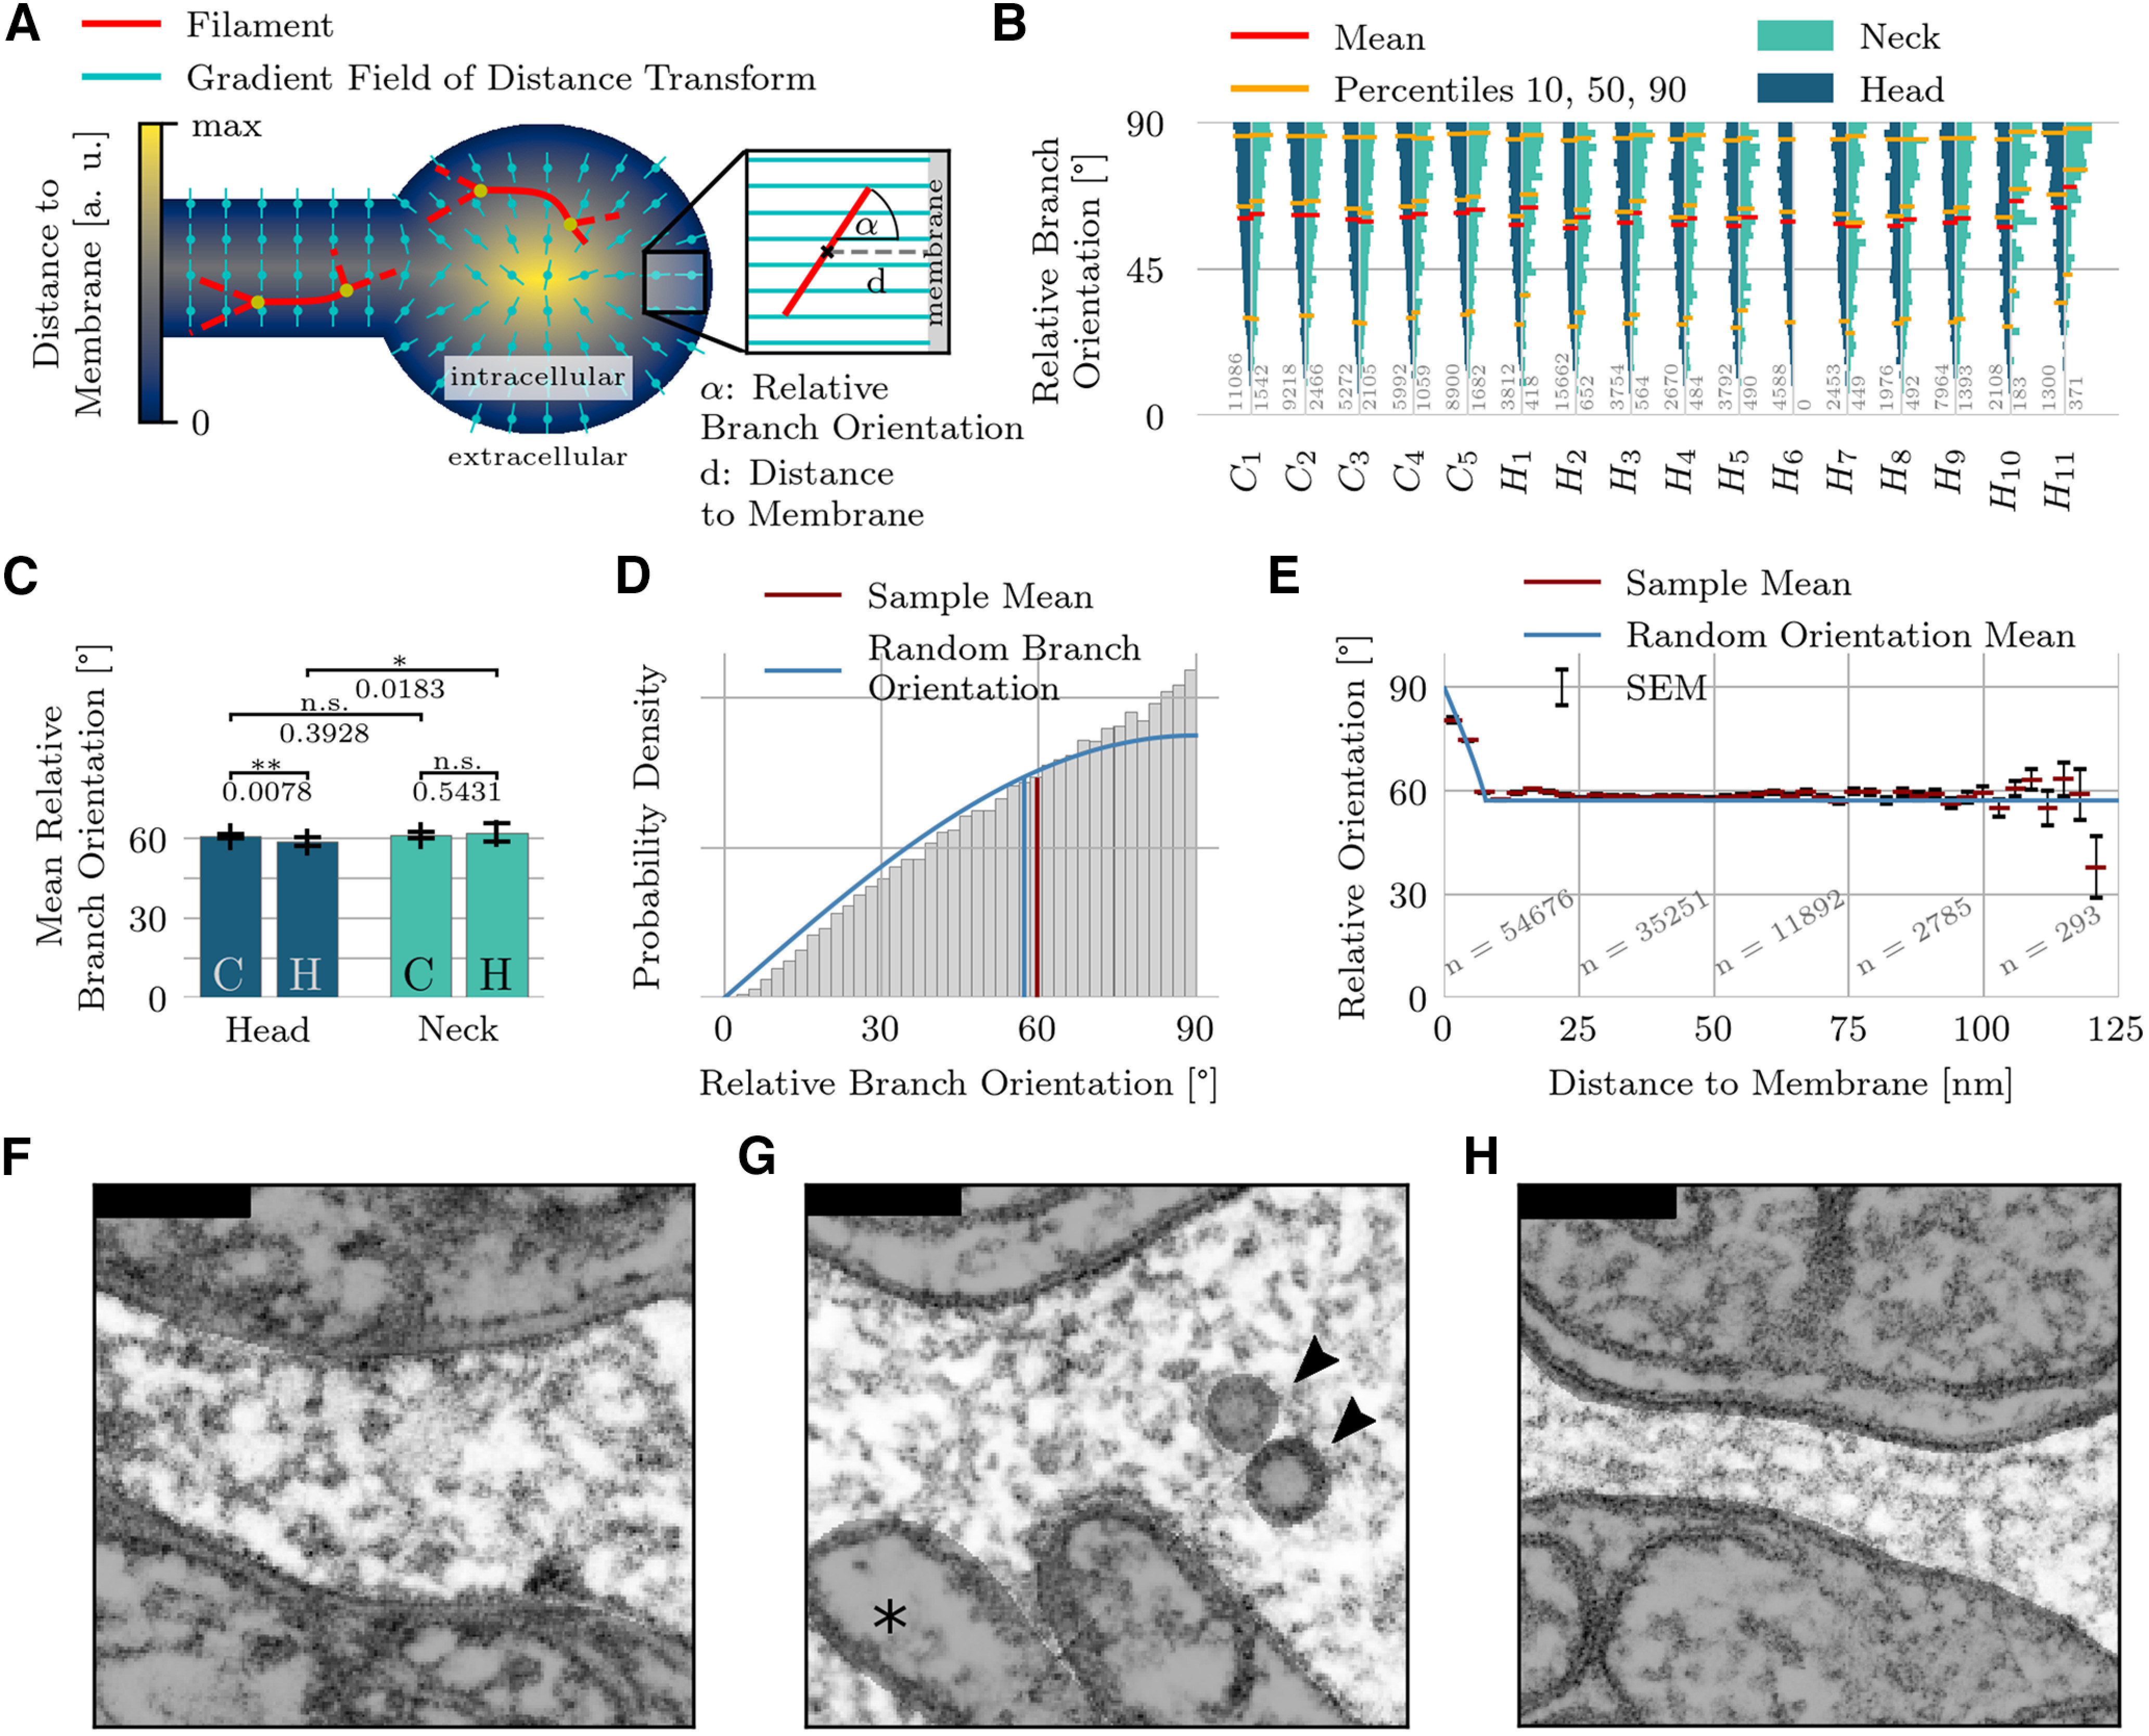
Branch orientations. A, The 3D orientation of a branch is given by the angle between the branch’s tangent vector and the reference vector field given by the gradient of the distance transform on the intracellular space. The distance to the membrane is always measured relative to a branch’s center of mass. B, Distribution of the relative branch orientations of the entire population, shown separately for head and neck regions. Sample size indicated by gray numbers. C, Pairwise comparison of mean relative branch orientations. Bar plots show mean and STD of the average branch orientations of individual spine domains. D, Full distribution of relative branch orientations pooled over all spines. Angles close to 90° are overrepresented compared with a distribution of random branch orientations in free space. E, Detailed analysis of mean relative branch orientation as a function of the distance to the membrane (Fig. 3E). The SEM is indicated by black bars. If one treats the branches as rigid rods, then branches in the immediate membrane vicinity must run parallel to the membrane, although orientations are generally random. F, G, Filaments in spine necks are typically not aligned with the neck’s main axis, as shown by two examples (F, C3; G, H9). Head of H9 contains organelles (arrowheads) and the dendrite mitochondria (asterisk). H, Long and thin spine necks do, however, constrain the filament orientation, as demonstrated by the H11 spine. The neck’s minimum diameter is 91.0 nm in C3, 86.5 nm in H9 and 35.1 nm in H11. Scale bars in F, G: 100 nm.