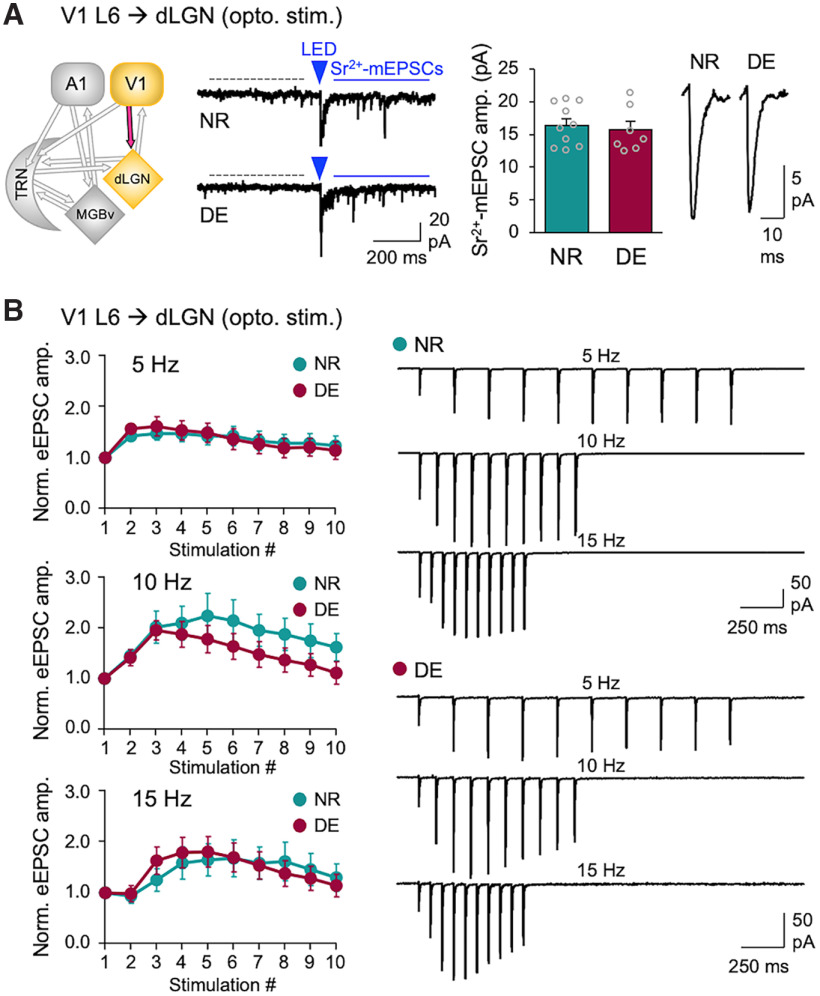
Figure 5.
DE does not alter V1 L6 corticothalamic excitatory synaptic transmission to dLGN. A, ChR2-evoked-Sr2+-mEPSCs recorded in dLGN. Left, Circuit diagram showing V1 L6 to dLGN input. Second panel from the left, Example traces of ChR2-evoked Sr2+-mEPSCs recorded in dLGN of Ntsr1-Cre;Ai32 mice. A 5 ms LED pulse duration was used. Labels are the same as in Figure 1D. Third panel from the left, Average amplitudes of Sr2+-mEPSCs (NR = 16.4 ± 1.0 pA, n = 10 cells; DE = 15.7 ± 1.3 pA, n = 7 cells; t test: t(15) = 0.4551, p = 0.6626). Bars, Mean ± SEM; gray circles, average value for each cell. Right, Average Sr2+-mEPSC traces from NR and DE. B, Short-term facilitation of V1 L6 excitation to dLGN. Left, Normalized average eEPSC amplitudes across different stimulation frequencies (5, 10, and 15 Hz). A 5 ms LED pulse duration was used. Plot, Mean ± SEM. Right, Average eEPSC traces from NR and DE across different stimulation frequencies. Two-way ANOVA; 5 Hz stimulation train: F(9,144) = 0.7509, p = 0.6617, NR = 7 cells from 2 mice, DE = 11 cells from 3 mice; 10 Hz stimulation train: F(9,135) = 1.732, p = 0.0875, NR = 7 cells, DE = 10 cells; 15 Hz stimulation train: F(9,117) = 1.285, p = 0.2524, NR = 6 cells, DE = 9 cells.

