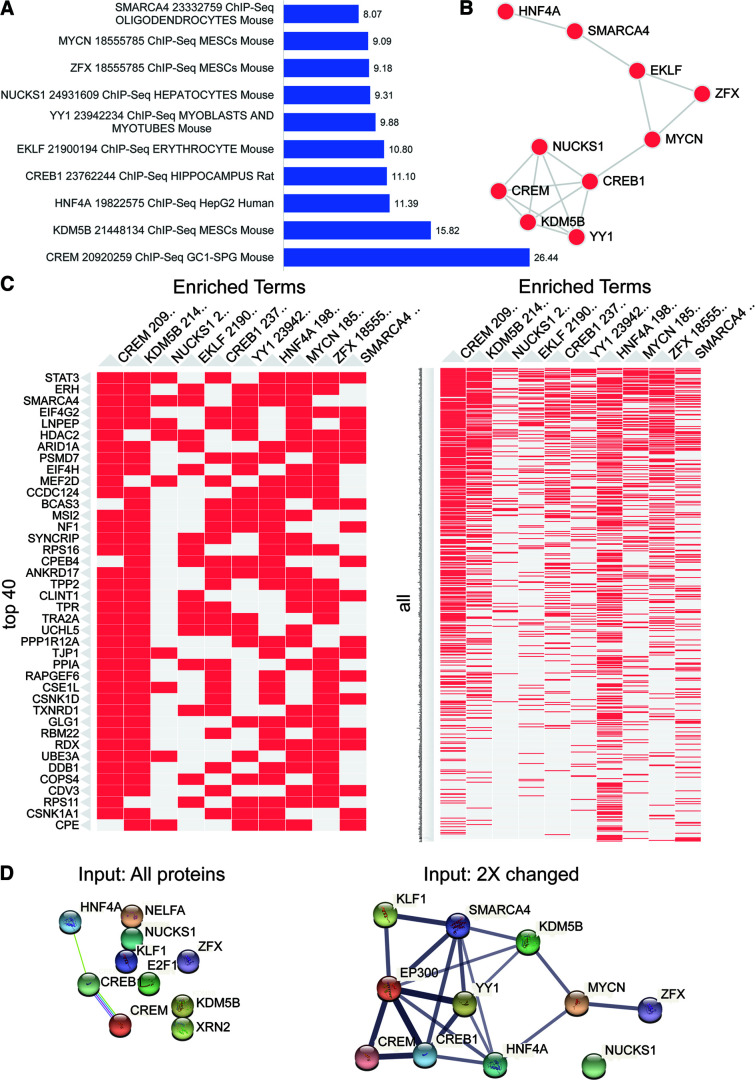
Figure 10.
Activity-induced NSPs are enriched in ChIP-seq targets of CREB1. Enrichr transcription analysis of dataset of NSP proteins that were changed more than twofold in response to PTZ treatment. The analysis was performed using the ChEA 2016 gene set library containing functional terms representing transcription factors profiled by ChIP-seq in mammalian cells. A, The top transcription factors, including information about the publication PMID number, cell type, and organism, are plotted by -log (p-value) shown next to the bar. B, Network showing gene content similarity between the gene set libraries represented by the top transcription factors. C, Clustergram showing the top 10 transcription factors (columns) with the top 40 input proteins (rows, left) or all input proteins (rows, right). The colored (red) cells in the matrix show whether the transcript of the input protein is associated with the transcription factor. D, Protein–protein associations mapped using the STRING database of the top 10 transcription factors from the Enrichr analysis using all proteins (left) or the twofold changed proteins in response to PTZ (right) as the input (Extended Data Figs. 10-1, 10-2, 10-3).

