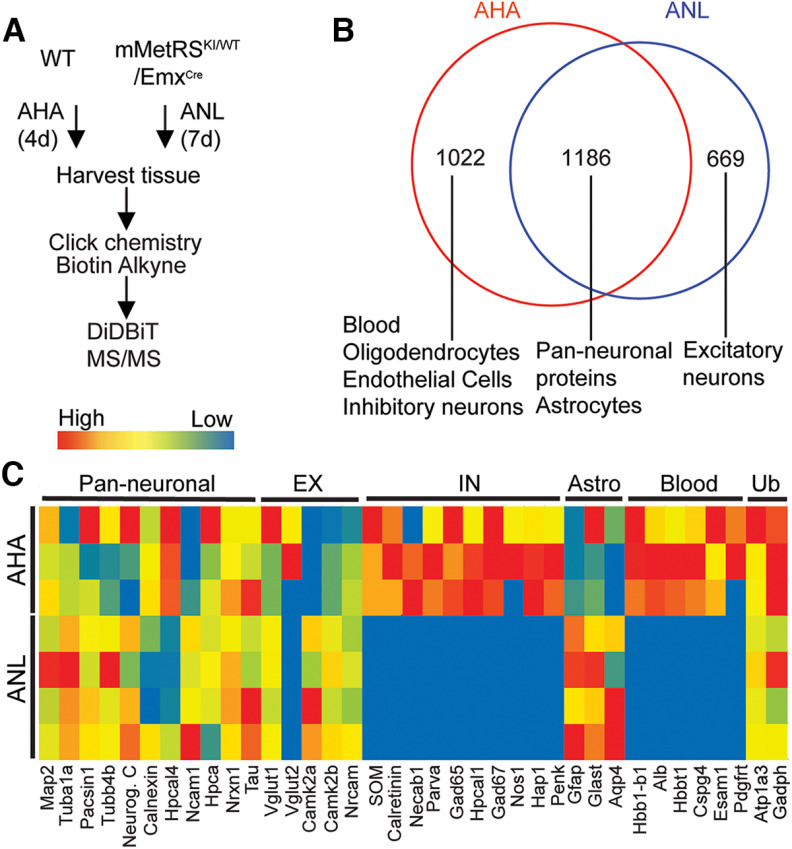
Figure 5.
Genetic control of mMetRS expression allows identification of NSPs in specific neural cell types. A, Schematic of the NSP labeling protocols for AHA and ANL. For global AHA labeling of NSPs, mice were fed AHA-laced chow ad libitum for 4 d. For neural cell type-specific labeling, mMetRSKI/WT/EMXcre mice received daily intraperitoneal injections of ANL (830 mg/kg) for 1 week. For mMetRSKI/WT/EMXcre samples, cortex was dissected from isolated brains and processed for click chemistry, DiDBiT and mass spectrometry protein identification (MS/MS). For AHA samples, the entire brain was processed for click chemistry, DiDBiT, and MS/MS. B, Venn diagram showing overlap between the AHA-labeled and ANL-labeled proteomes. AHA-labeled samples include proteins from blood, vasculature (endothelial cells), oligodendrocytes, and GABAergic neurons that are absent from ANL-labeled samples. Proteins detected in both AHA-labeled and ANL-labeled samples include astrocyte and pan-neuronal proteins. Proteins uniquely labeled with ANL are annotated to excitatory neurons and astrocytes, consistent with the distributions of mMetRS expression in mMetRS/EMXcre mice (Extended Data Fig. 5-1). C, Heat map of relative detection of proteins from excitatory neurons, inhibitory neurons, astrocytes, blood, and ubiquitous proteins (Ub) across 4 independent MS/MS runs of samples from mMetRSKI/WT/EMXcre mice (2 males and 2 females) and 3 independent MS/MS runs of AHA samples (3 males), based on spectral counts from markers of different cellular populations in ANL- and AHA-labeled proteomes (Extended Data Fig. 5-2).

