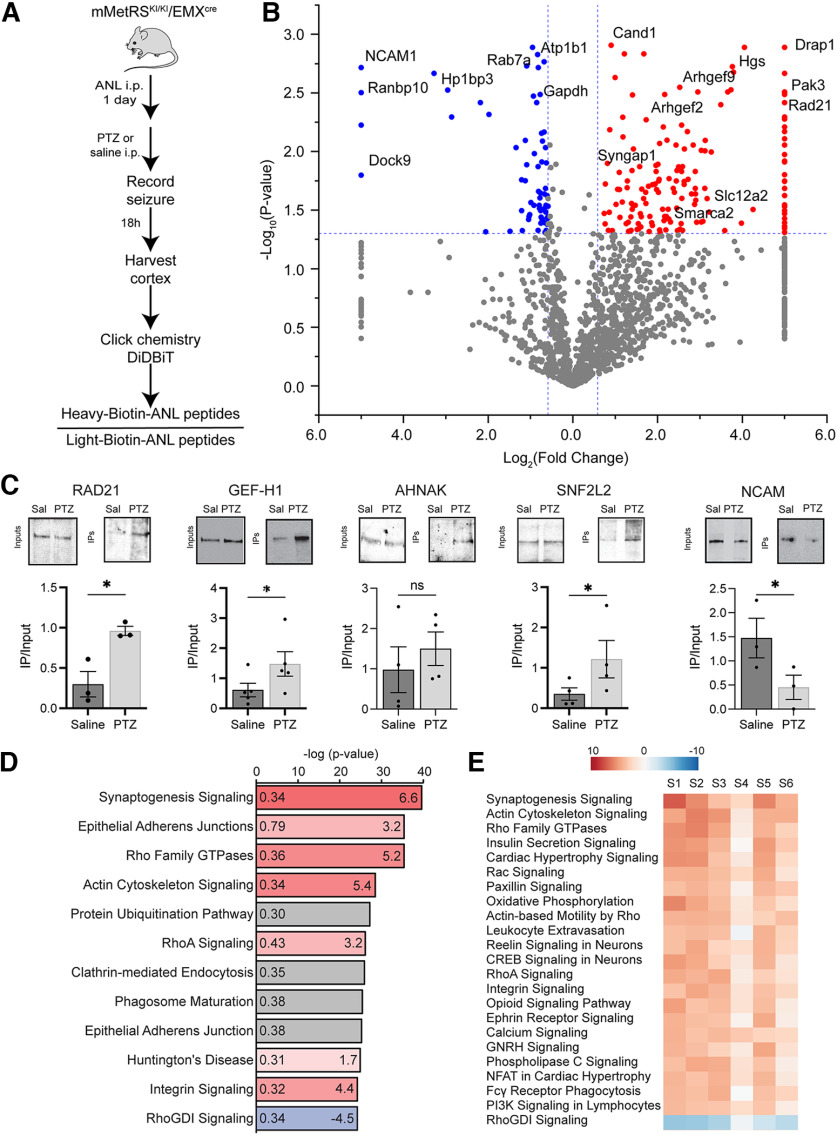
Figure 7.
Temporal control of ANL treatment improves MS/MS detection of newly synthetized proteins in excitatory cortical neurons after acute seizure induced by PTZ. A, Experimental design to identify changes in newly synthetized proteins after acute seizure. mMetRSKI/KI/EMXcre mice received a single intraperitoneal dose of 47 μg/kg PTZ together with ANL or saline; 18–20 h later, brains were collected and cortex was isolated and processed for click chemistry with heavy and light biotin alkynes and DiDBiT to isolate biotinylated peptides for mass spectrometry protein identification. B, Volcano plot showing quantitative proteomic analysis of changes in newly synthesized proteins induced by PTZ compared with saline. N = 4 independent experiments (3 pairs of males and 1 pair of females). Significantly increased and decreased (p < 0.05, |FC| > 1.5) newly synthetized proteins are labeled in red and blue, respectively (Extended Data Fig. 7-1, see for list of all quantified peptides; Extended Data Fig. 7-2, see for lists of proteins from the 7 and 1 d ANL treatment experiments). C, Western blots of inputs and IPs comparing selected NSPs in saline-injected and PTZ-injected samples. Quantification of labeling: individual datapoints and mean ± SEM; N = 4 independent samples. *p < 0.05 Student's t test with Welsh's correction. n.s., not significant; sal, saline. D, IPA (QIAGEN) canonical pathway analysis identified the signaling pathways that change the most in response to PTZ treatment compared with saline treatment. The color of bars represents the z score (values provided to right within bars) that predict increases (red) or decreases (blue) in the function of each pathway. The gray bar represents pathways where no prediction can be made (Extended Data Fig. 7-3). E, Comparative analysis showing z scores of the most significantly changed canonical pathways across 6 independent samples (S1-S6; 3 pairs of males and 3 pairs of females; Extended Data Fig. 7-4).

