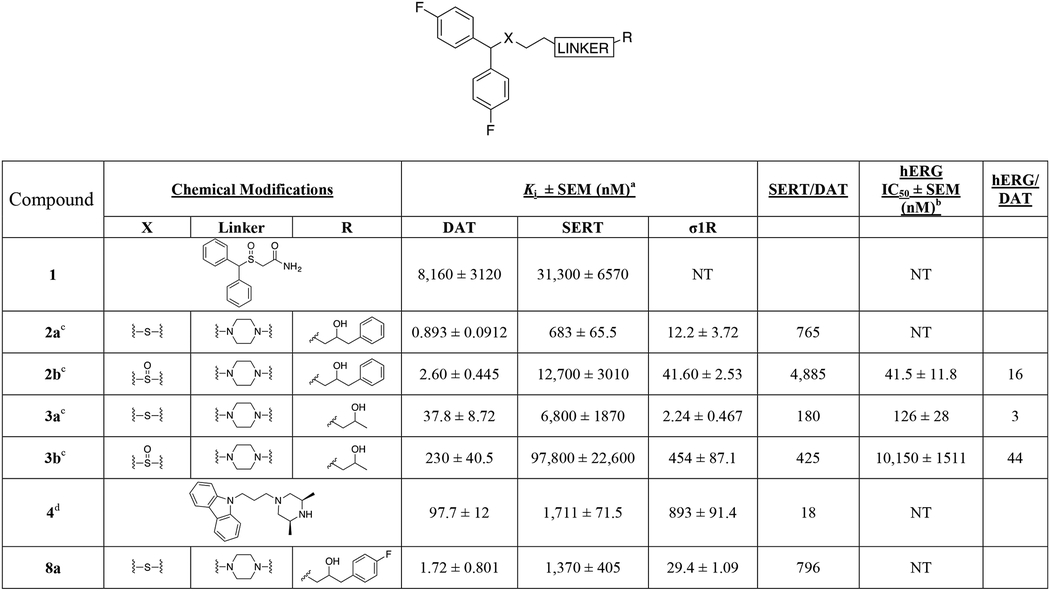
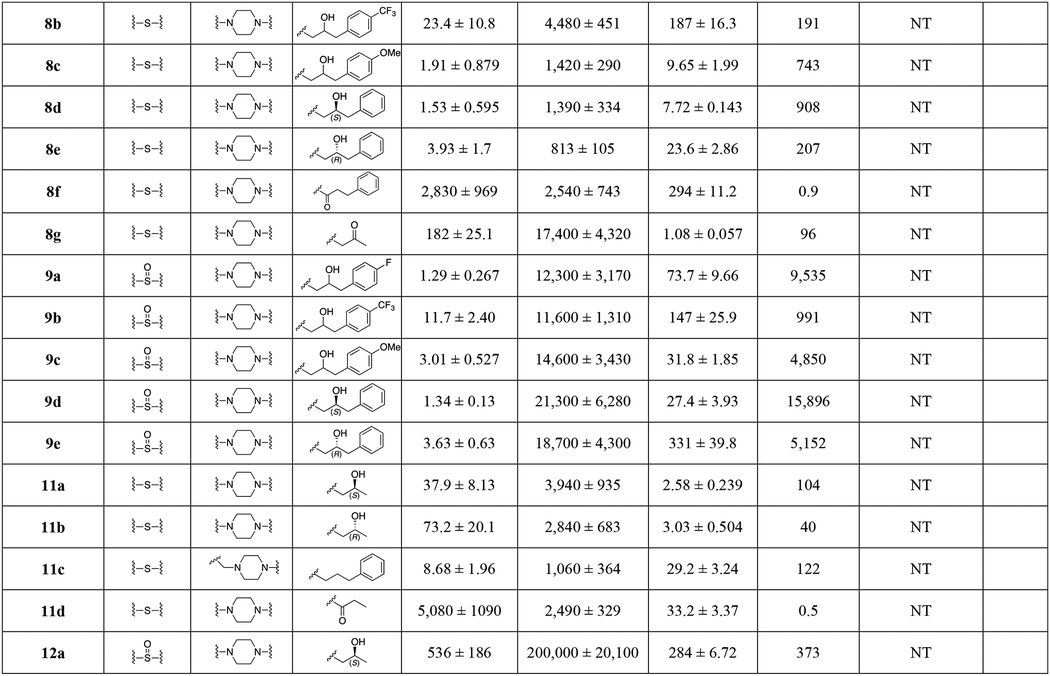
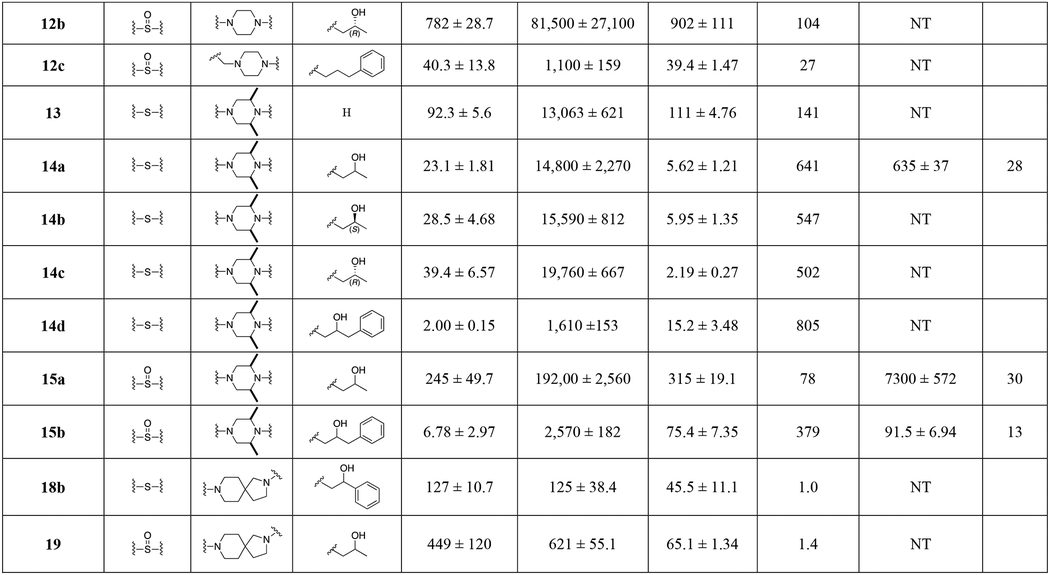
Table 1.
Binding Data for Sulfenyl-, and Sulfinylalkylamine Analogues.a


|
Each Ki value represents data from at least three independent experiments, each performed in triplicate. Ki values were analyzed by PRISM. Binding assay procedures are described in detail in Experimental Methods.
Concentration (log) response curves were fitted to a logistic equation (three parameters assuming complete block of the current at very high test compound concentrations) to generate estimates of the 50% inhibitory concentration (IC50). The concentration-response relationship of each compound was constructed from the percentage reductions of current amplitude by sequential concentrations. NT; not tested.
data from ref. 32.
data from ref. 62.
