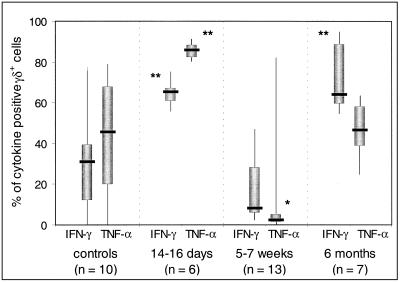
FIG. 4.
Frequency of cytokine-producing γδ+ T cells at various intervals after onset of legionellosis. Cytokine analysis was performed on CD3-gated cells double stained with anti-γδ antibody and anti-cytokine antibody or an isotype control antibody. The thick line through each box shows the median, with quartiles at either end. The vertical lines indicate maximum and minimum values. ∗, significantly different from controls at P < 0.05. ∗∗, significantly different from controls at P < 0.01.

