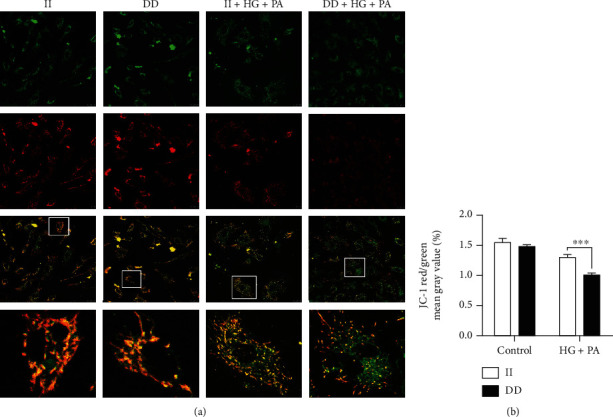
Figure 3.

Mitochondrial membrane potential decreased more significantly in NFKB1 DD-mutant cells. (a) Representative confocal photomicrographs stained with JC-1. (b) JC-1 red/green means gray value. HUVECs were treated with 25 mM glucose and 250 μM palmitic acid (PA) for 3 hours. Data represents the mean ± SEM of at least three independent cell culture preparations (more than 10 visual fields per group). ∗∗∗P < 0.001.
