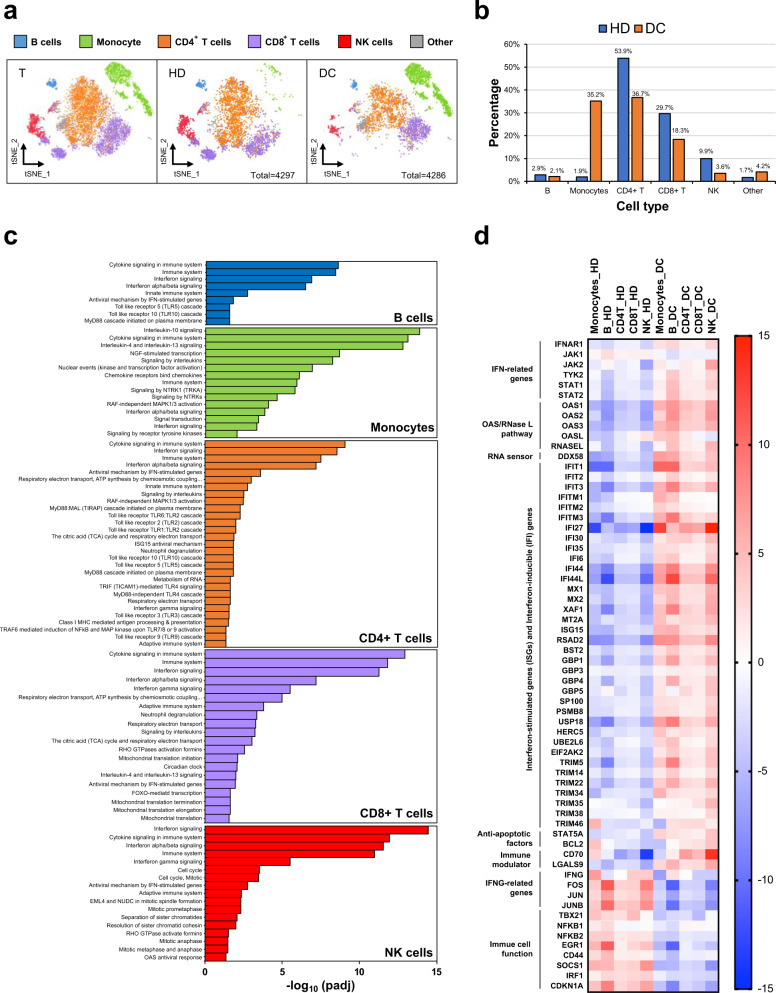
Fig. 2. Single-cell RNA-seq of PBMCs showing immunodeficiency in the DC patient.
a t-distributed stochastic neighbour embedding (tSNE) analysis of PBMCs from the healthy donor (HD) and DC patient. A total of 4297 and 4286 single cells for the HD and DC subjects were clustered into five major clusters (B cells, CD4+T cells, CD8+T cells, monocytes, and NK cells). Cells were annotated by independently correlating each cell with reference transcriptomic datasets. T, Totality of cells analysed; HD, healthy donor; DC, DC patient. b Bar graph showing the percentage of each cell type relative to the total cell numbers in the healthy donor or DC patient. c Enriched pathways in the DC patient by Reactome analysis in each immune cell subset. d Heatmap of anti-pathogen response genes in immune cells for the healthy donor and DC patient coloured by average fold change.

